Meet the Framework Plan: A Flexible Master Planning Approach
As context and constraints evolve in a university setting, it’s important to have a structural understanding of how decisions will be made
Most planning and design projects involve data collection and analysis, but for these numbers to be useful, we need to translate them into action. Sasaki’s space planning practice prioritizes this jump from data to results: our teams push data analysis into implementation. What do the data say about the future of education at an institution? How can we use data to ask more insightful questions, make informed decisions, and explore new opportunities?
When working with academic institutions, our planners find ways to translate a myriad of data—academic space utilization, student life space, faculty needs, and more—into context-driven roadmaps that guide a client to make the most of their space. Sasaki planners employ data analysis tools to understand and form new relationships among data that would otherwise be complicated to piece together. Planners use this groundwork as a platform upon which actionable strategies are based.
Sasaki’s in-house data and design tools group is the driving force behind constructing our data analysis tools. This team is made up of designers and developers who create digital tools in-house—they both tailor tools to work for specific projects and build entirely new custom tools. Rather than offering a prescriptive solution to our clients, our teams treat each project on a case-by-case basis to determine specific needs.
One of the group’s most-utilized tools is CoMap, a collaborative mapping program that generates a spatial visualization of how people experience a campus or region. When used at institutions, CoMap’s survey function invites campus communities to add notes about places or trace routes on a map of the campus. Based on the comments left on the map, our planning teams collect community feedback about various locations and pathways that then inform their space planning approach.
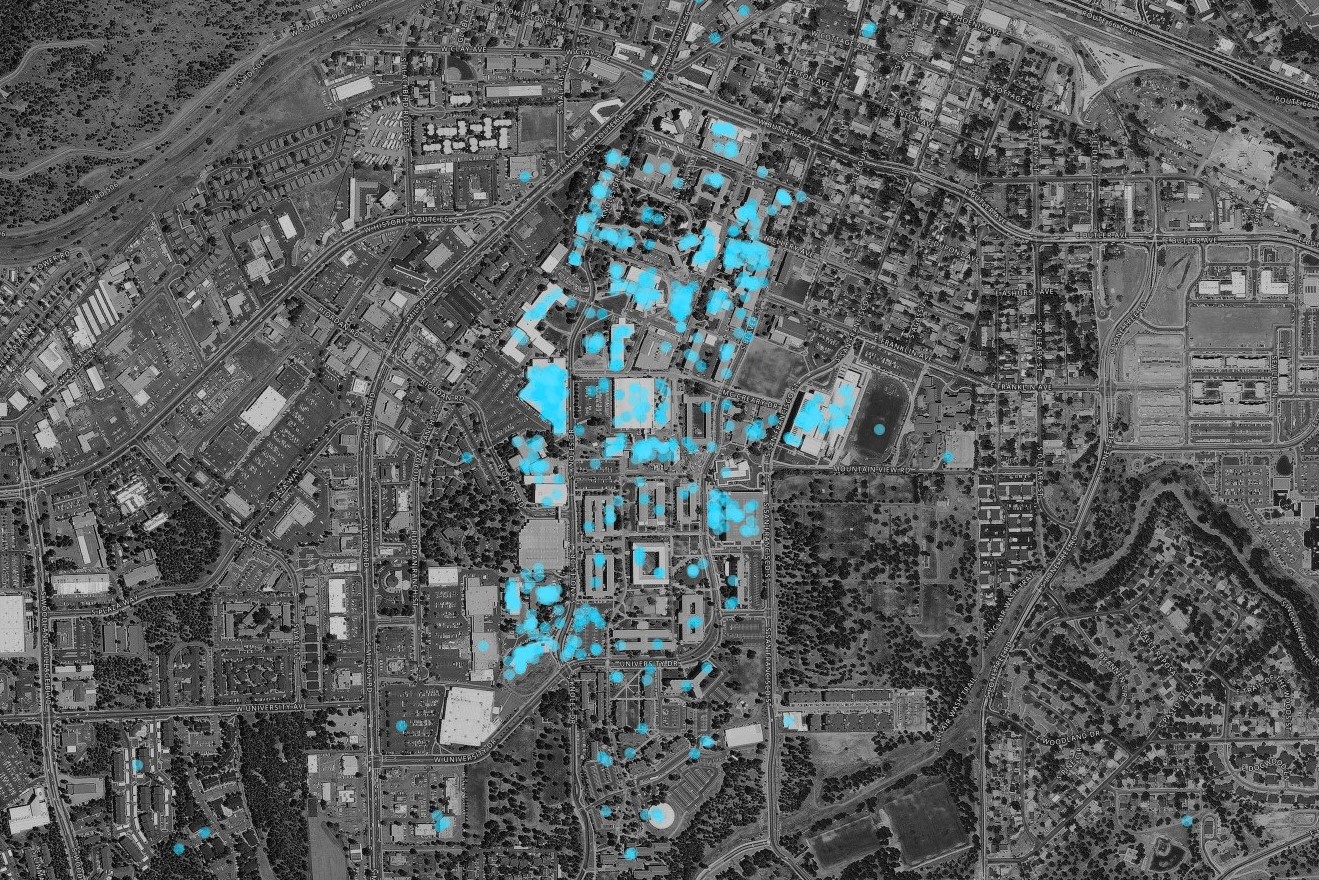
NAU’s North Campus collaboration and study spots. CoMap data shows that students collaborate all over campus, with strong nodes at Cline Library and the Student Center, but with opportunity to enhance collaboration space along the Science Corridor.
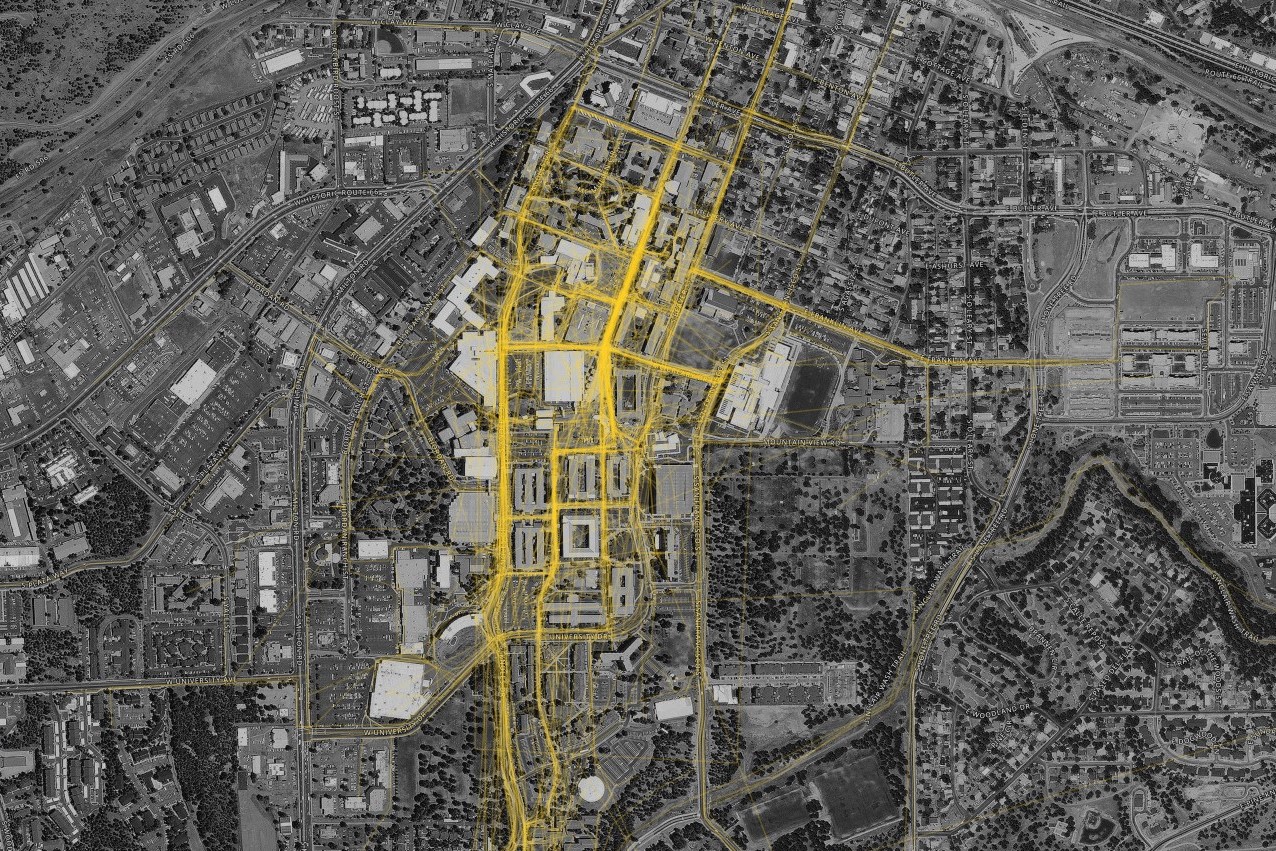
North Campus walking patterns at NAU. There is a strong north-south pedestrian activity along the Pedway and Knoles Drive, as well as a strong east-west connection between Cline Library and the Health and Learning Center.
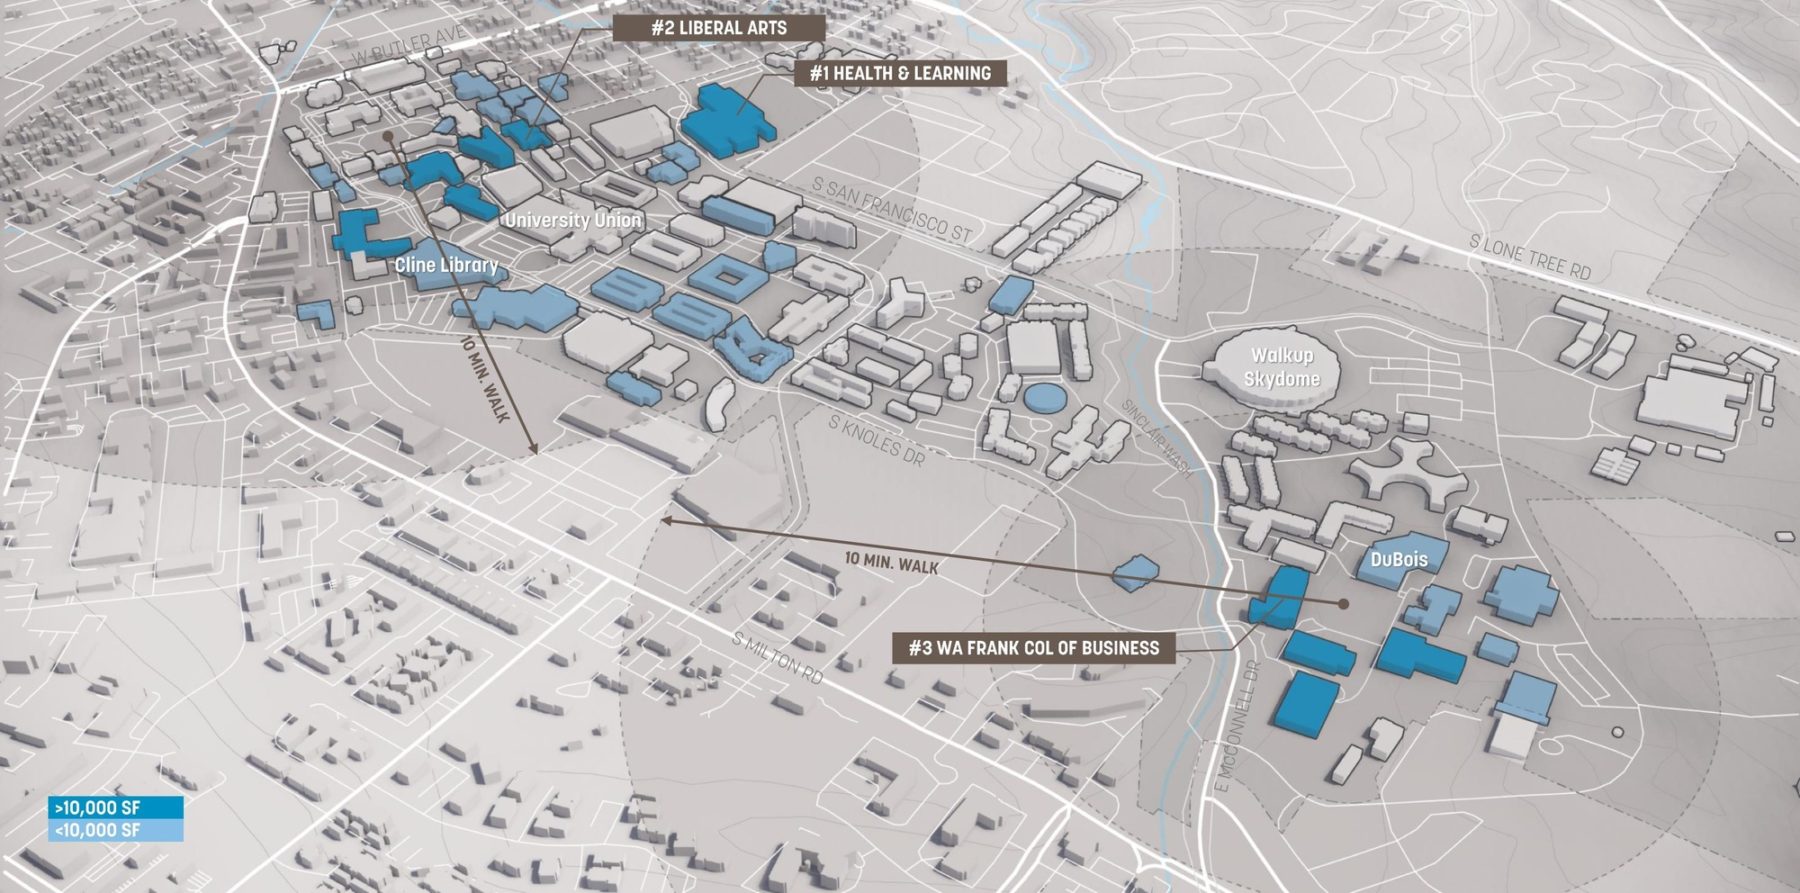
At Northern Arizona University (NAU), Sasaki conducted a comprehensive space assessment for the whole campus. One aspect of that work focused on assessing the university’s research and teaching space in support of STEM programs. After using CoMap to observe how students move throughout the university’s science district, the team observed that the new STEM building, along with providing critical teaching and research space, should also serve as a collaborative hub that anchors the entire district. “CoMap revealed patterns in student movement that showed us where collaboration spaces should be located throughout the district,” adds Sasaki principal Tyler Patrick, AICP. “Visualizing those connections is what helps us develop a planning strategy that impacts the overall student experience.”
Sasaki again employed CoMap to develop the fundamental priorities for The Pratt Institute’s space planning study. In the survey, the team customized a series of questions to ask the campus community, including,
What are your favorite classrooms?
What are your favorite studios?
Where do you collaborate?
The team mapped the responses to these questions and found that increased enrollment, the addition of new academic programs, and deteriorating buildings were the main concerns among students, faculty, and staff. Engaging with the community through use of CoMap clarified where the team should focus their energy in the space planning study.
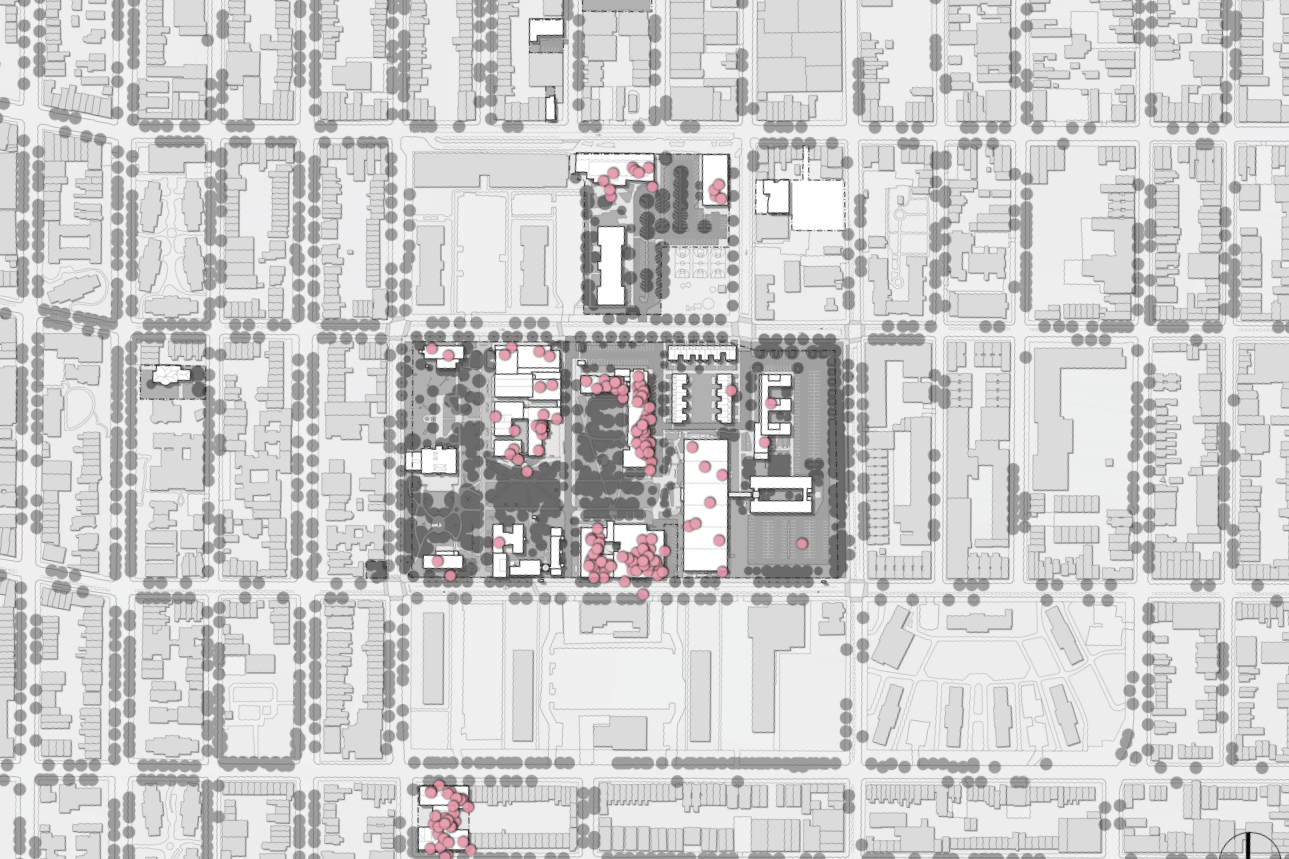
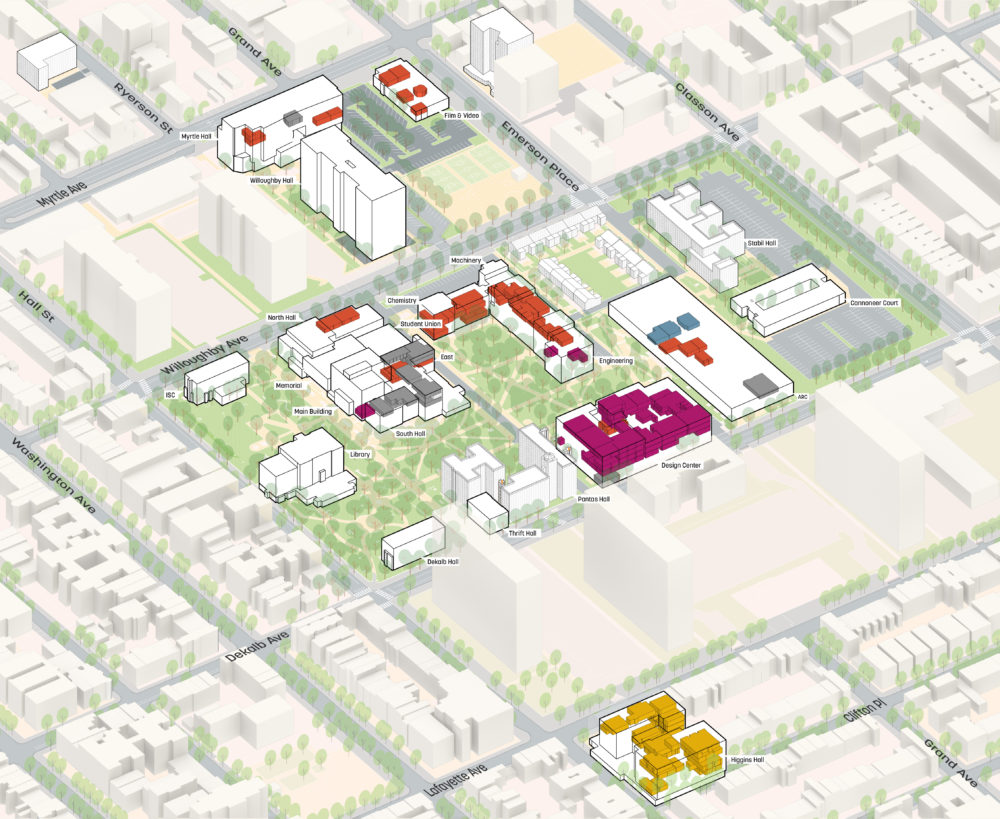
CoMap responses to the question: Where are your favorite studios?
If customizing an existing tool doesn’t meet a client’s needs, planners will work with the data & design tools group to create new tools that solve specific challenges. In one such case Patrick conceived of a tool that would help process complex data about science courses for Michigan State University (MSU). The university was building a new STEM building that was primarily comprised of teaching labs. On the whole, teaching labs usually experience lower utilization rates than classrooms due to the specialized nature of equipment, storage needs, etc. MSU, however, wanted its new building to be highly utilized. Designing teaching labs that could be used around-the-clock meant unlocking strategies to enable flexible lab design.
The data & design tools team ran with Patrick’s idea. They worked together to develop a dashboard that displayed live data for science courses—including the type of course, the class size, and more—and gave the design team the ability to assign each course to a lab prototype. The prototypes were developed to support all of the unique core attributes required to teach the range of STEM courses; however, the strategy also relies on appropriate equipment room and storage space so that specialized equipment could be moved in and out as needed, thereby enabling maximum flexibility. In the end, approximately twelve lab prototypes were developed to support the range of 100 and 200-level courses offered in the STEM disciplines.
The dashboard kept track of how many labs of each type would be needed to accommodate all classes, quantified how much space was left for backfill once the existing teaching labs moved into the new building, and specified, based on earlier analysis, whether that space could be reused for office, research, or teaching space. With the dashboard’s help in piecing together the puzzle, the Sasaki team found a way to efficiently program MSU’s new teaching labs, as well as thoughtfully and effectively reuse existing space on campus.
While tools are essential for data collection and analysis, translating these numbers into priorities and strategies relies on human expertise. Once the quantitative analysis is defined, our planners collaborate with stakeholders to create actionable strategies that are well-informed and that address programmatic need.
At NAU, the planning team used data tools to understand and visualize the range and extreme variety in office size, type, and quantity across the university. Our visualization highlighted an inequity in office quantities and sizes across departments. To address this, the team developed a set of regularized office typologies and standards that can be deployed during renovation and new construction. The typologies are not meant to be confining; on the contrary, they serve as a flexible toolkit that can be drawn upon as designers work with individual units to implement projects.
Drawing from CoMap data collected at Pratt, the Sasaki planning team developed program statements that define Pratt’s space needs. These strategies—written for each of Pratt’s six schools, its first-year Foundation program, and the Brooklyn Campus Library—describe each program’s existing conditions, outline their needs, and suggest opportunities to optimize space use within each program’s building.
From collecting data to charting a strategy, our space planning projects are designed to drive future projects. At both NAU and Pratt, the space analysis study serves as a precursor to a full master plan, providing a platform for multiple stakeholders to voice their needs early in the process. Because of the comprehensive nature of a space analysis study, planners can approach the master planning process with a global view, making connections between departments and crafting the plan from a more integrated and interdisciplinary perspective.
At Smith College, Sasaki’s Learning Space Master Plan defined a series of implementation projects, including the first project, a renovation of a classroom in Seelye Hall. Based on the principles defined in the Learning Space Plan, the classroom’s design will facilitate collaboration between students and faculty while supporting multiple learning activities such as lectures, discussions, group work, and team-based learning. Additionally, the renovated space will provide plenty of writing and projection surfaces for sharing ideas and information. The room’s technology is designed to function seamlessly and unobtrusively in learning activities, and when it is not in use, ample storage space allows the technology to be put away, removing the potential for distraction.
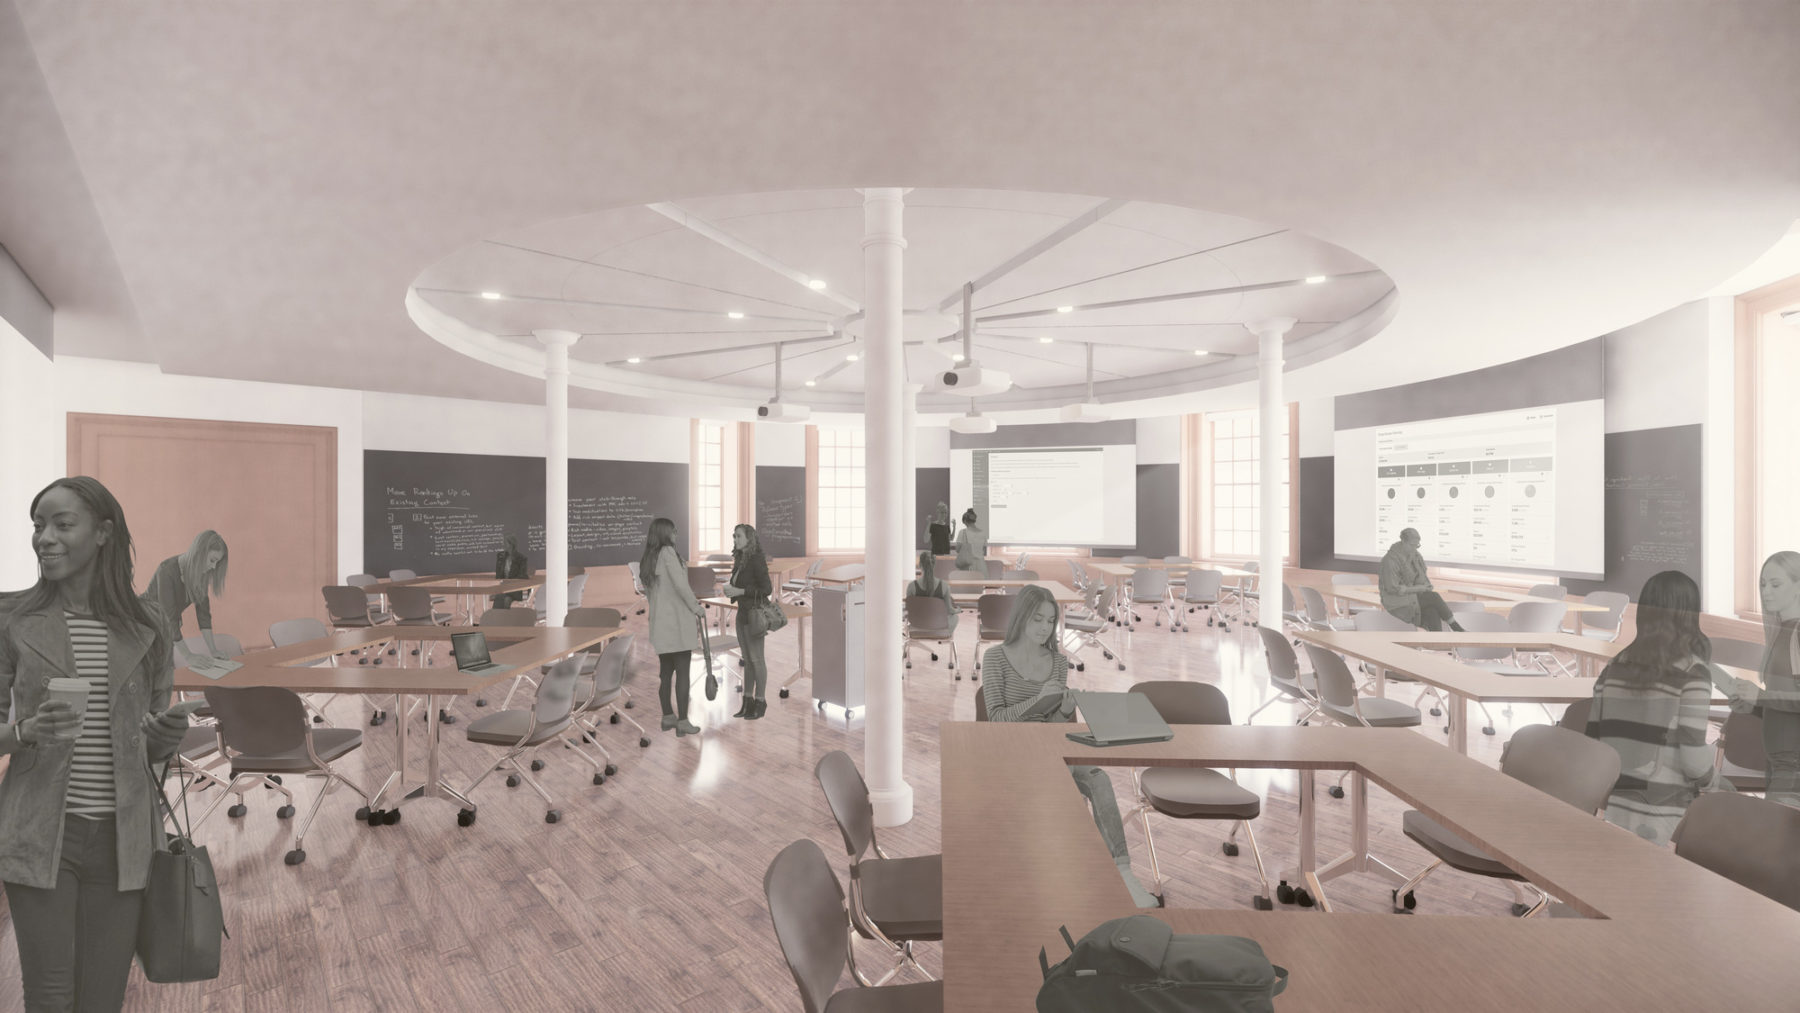
A vision for Seelye Hall’s classroom renovation
Moving beyond the data is a consistent driver in our space planning work. When our teams take a space planning project from analysis to implementation, we ground our approach in customized data analysis and strive to translate that data into actionable strategies for our clients. Our work with academic institutions is context-driven, outcomes-based, and forward-thinking; our planners focus on understanding the institution’s present and thoughtfully and strategically planning for its future.
As context and constraints evolve in a university setting, it’s important to have a structural understanding of how decisions will be made
Tyler Patrick discusses space planning at Emory University at the annual meeting of the Society for College and University Planning (SCUP)