Density Atlas Launches
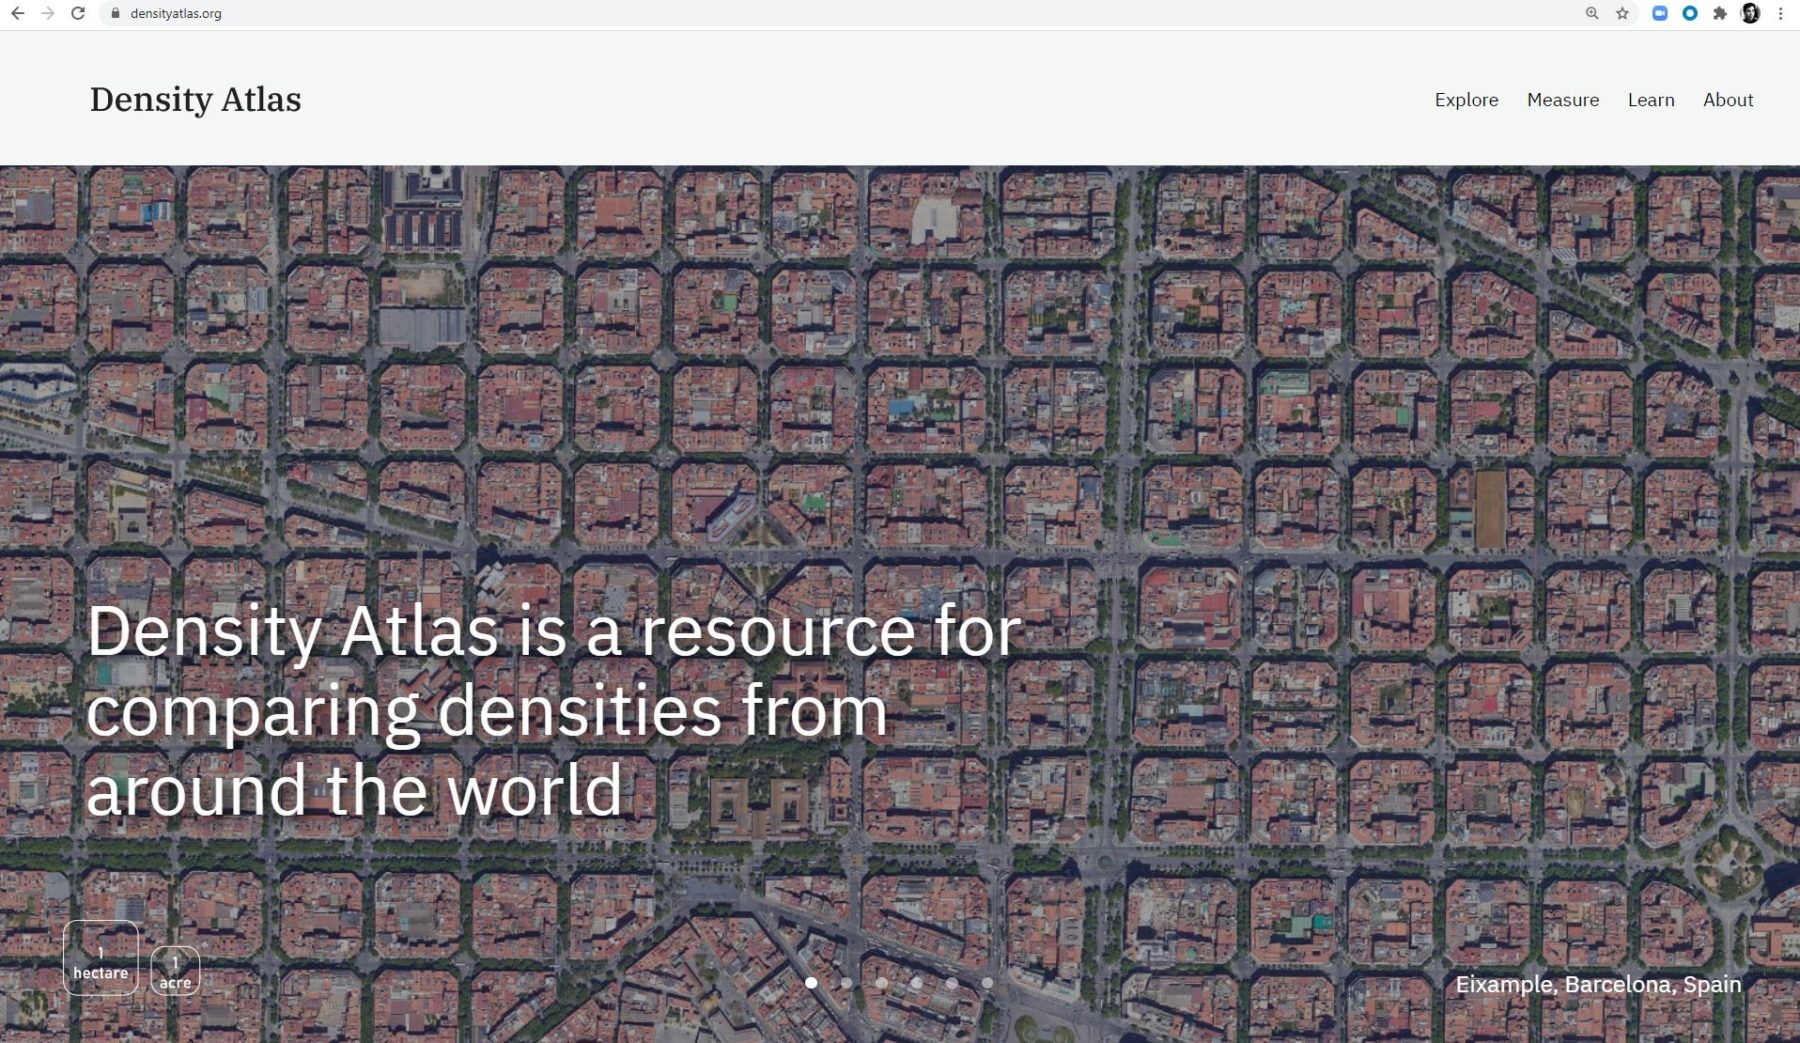
Today, Sasaki launches densityatlas.org a new resource for planners, urban designers, developers, interested urbanites, and students of the public realm to arrive at a better shared understanding of density, by defining density with common metrics, and cataloguing how density manifests in different contexts around the world.
The Density Atlas has been revamped from previous iterations developed over the course of 10 years by the late Tunney Lee, professor emeritus of urban planning and former head of the MIT Department of Urban Studies and Planning (DUSP), and many students and collaborators who have touched the project over time. Today’s revamped website unpacks the limitations of how density has been thought of and starts to define a more standardized set of metrics for understanding and comparing density across disparate global contexts.
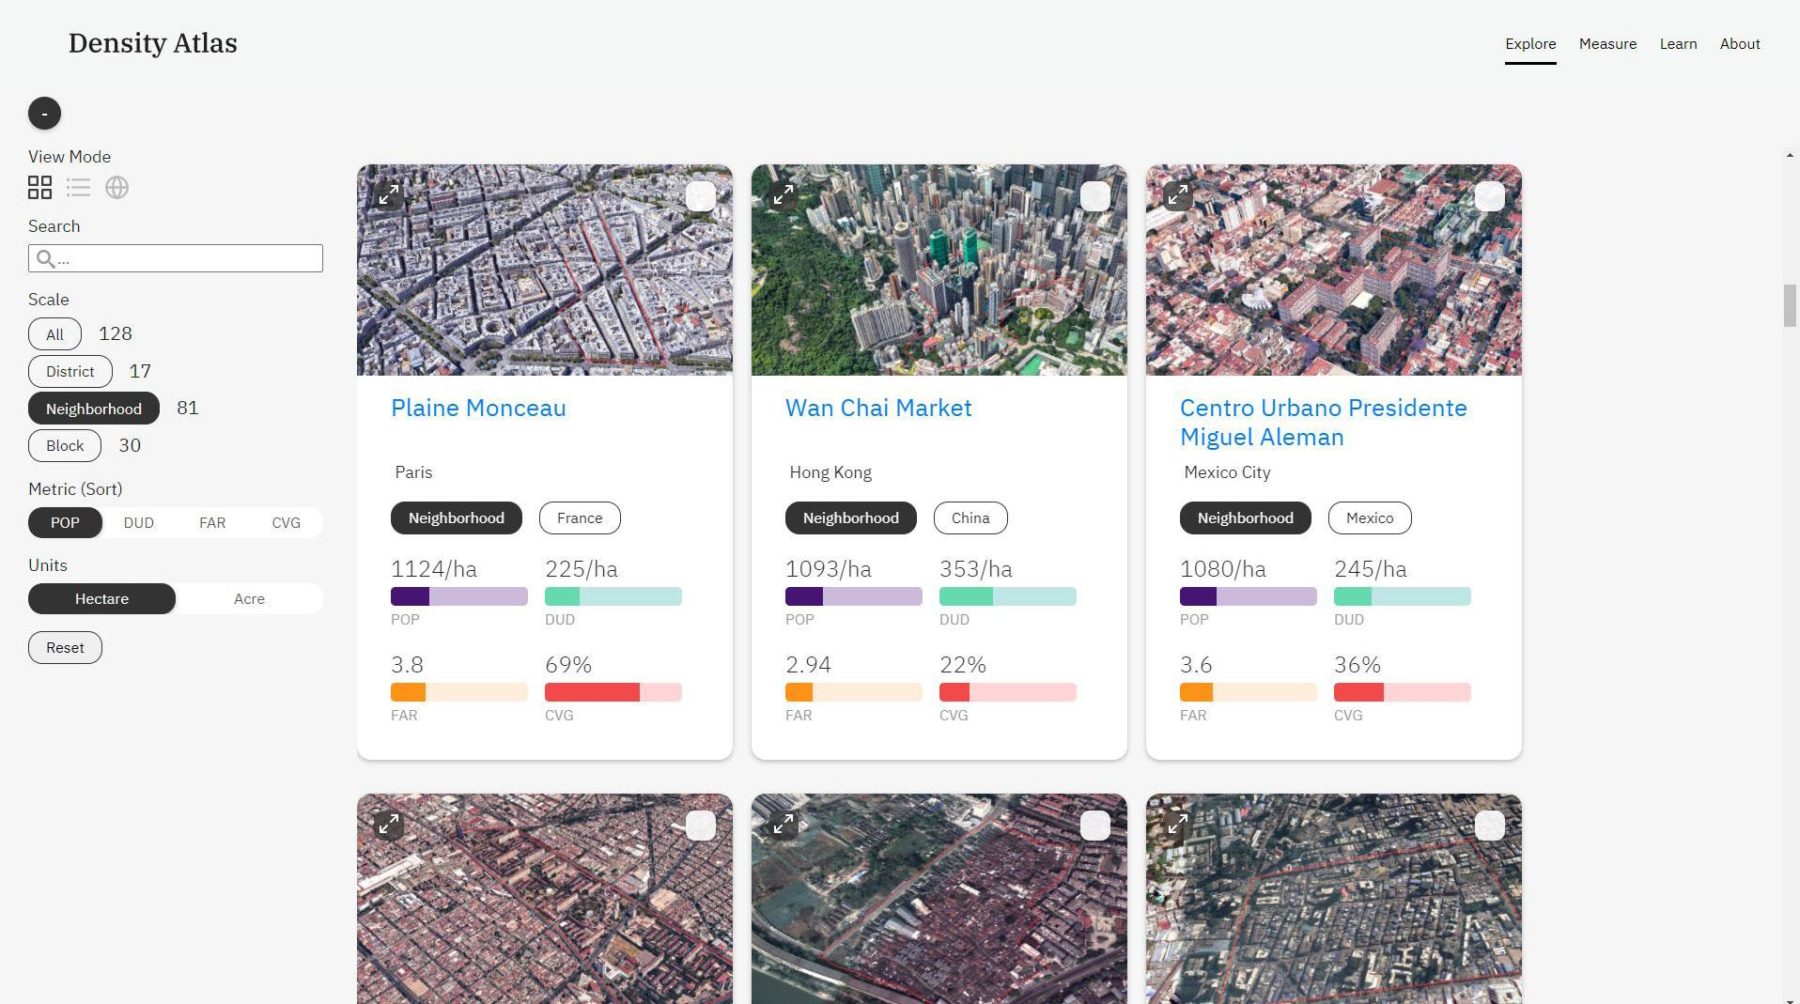
Three very different locations from around the world have very similar densities. By comparing different locales using like-metrics provide a picture of the levers planners, developers, communities, and designers can use to adjust the expression of density in different ways
This conversation around density comes at a particularly timely moment as questions within public discourse abound around density’s role in COVID-19’s spread and what density goals should be for cities post-pandemic. “Density is often vilified and equated to overcrowding,” explains Mary Anne Ocampo, a principal at Sasaki and president of the board for the Sasaki Foundation. “This project aims to clarify what density is, isn’t, and can be so that we can have more productive dialogue around planning, development, and design to better serve people and our shared environments.”
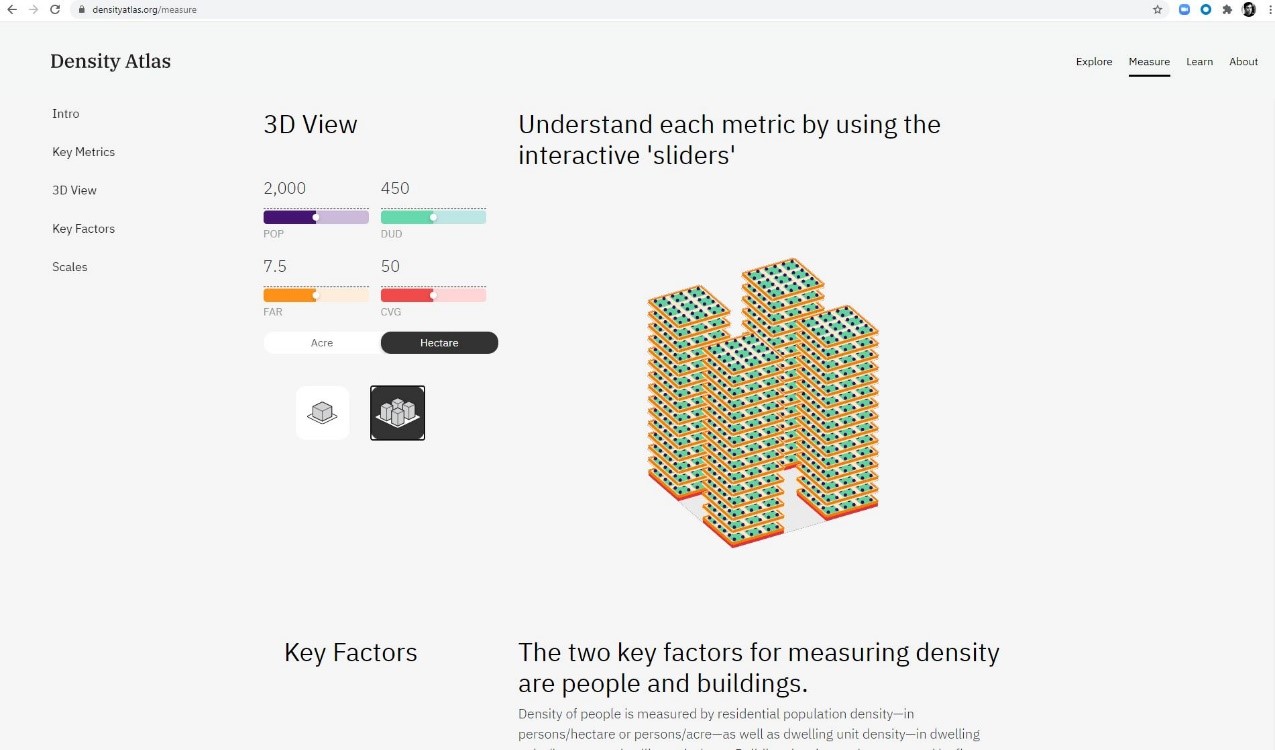
Lee charged Sasaki with continuing to steward the project and with support from the firm and the Sasaki Foundation, a team of Sasaki designers, planners, technologists, graphic designers, and a talented and committed intern from MIT, was able to expand upon the sites infrastructure with significant improvements. “The new interface allows users to easily compare different case studies and understand the physical implications of each different metric of density in the urban environment,” says Victor Eskinazi, a Senior Associate at Sasaki who worked closely with Lee and his team while at MIT. “The site also provides better tools for us to continue to add new cities and neighborhoods to the Atlas in the future.”
See below for a full abstract about the project from the multidisciplinary team and head to the website to check it out for yourself!
About the Density Atlas
The year 2008 marked the point when the world population shifted from a majority of rural dwellers to urban dwellers. American cities are experiencing a revival of their centers and an exploration of denser suburbs. As discussions of “how dense to build” arise, they often include misconceptions of what constitutes a “dense” neighborhood.
“Density” is a blunt expression that misses the nuances of urban design and social elements that contribute to a neighborhood’s desirability. To help the discussion, the Density Atlas was developed as a resource to compare urban settlements using a standard metric and scale system. These comparisons allow planners, architects, developers, and students to understand the implications of population, building footprints, and urban design in residential densities across the world. The Density Atlas has more than 120 case studies of what density can look like in three distinct scales: district, neighborhood, and block, that will help inform decisions regarding our built environment.
This study came about partly from discussions in Professor Tunney Lee’s planning and design studios in MIT’s Department of Urban Studies and Planning (DUSP.) Often, faculty and students struggled with defining density for a specific development. In researching the topic and looking for precedents, they found that most studies focus on density at the city and district scales, but few at the neighborhood level. Also, the varying metrics and scales used by each study generally led to ill-informed comparisons and conclusions.
In 2019, the Density Atlas was handed over from MIT DUSP to Sasaki for stewardship and improvement. This resulted in a fully redesigned website with expanded capabilities for exploring and comparing case studies. Future enhancements will include new visualization methods as well as the ability to crowdsource within Sasaki new cases based on our own projects. Densityatlas.org is set to go online this Spring.
References
BSA exhibit link: www.architects.org/exhibitions/density-atlas-measuring-urban-density