NRPA Innovation Lab: Three Sasaki Perspectives

Parks planning, design, and management is hardly what it appears to be like on television. It’s hard work—important work—to think about how parks best serve the needs of diverse populations and stand to spur vitality and development in the neighborhoods surrounding them. One of the great opportunities for the development and management of these public amenities lies in being able to make better decisions than ever before with data—and lots of it. The flipside of that opportunity is challenge, as making sense of that information can be a daunting undertaking.
The upcoming NRPA Innovation Lab, “Data Driven Government and Parks and Recreation”, coming to Boston next week, seeks to address this very topic. How can we use data to our advantage in creating green spaces for the people who need them most? A few of our urban planners and data strategists will be presenting their ideas and findings in-person at the Innovation Lab, but as a preview, they have compiled a few thoughts to share in advance.
Read on for perspectives on what makes for good metrics, how prioritization of investment can be helped by data, and why the development value of parks matters from some of Sasaki’s most passionate urbanists, park lovers, and data enthusiasts.
By Brad Barnett. Brad is a planner and designer in Sasaki Strategies, where he works at the intersection of technology, data visualization, and urban design.
“What gets measured gets done” is a truism within management circles. Parks planners embrace this philosophy and have long utilized measures such as Acreage per 1,000 Population and Expenditures per Resident to answer questions like:
• Are we providing enough and the right kinds of services that users need?
• How do we compare to other cities or parks systems?
• Where is the greatest need for us to invest our resources?
But acreage of parks or dollars spent cannot provide full answers to these questions, as these types of data serve as proxies of success rather than direct measures of effectiveness.
What does this mean? Let’s take an example from another field with a long history of metrics use—transportation planning—which has just recently found better measures to represent performance. They’ve started to measure accessibility, examining how many amenities (jobs, playgrounds, grocery stores) a transportation system user can access in a given period of time. Accessibility measures highlight what ultimately matters—user needs and how they’re being met—and that kind of insight allows transportation planners to be more creative in how they plan a network.
Parks planning has an opportunity to take advantage of the same forces that have led to the rise of accessibility measures in transportation planning.
The first force is data availability. Today, tools like OpenTripPlanner allow us to go beyond traditional 10 minute walk circles; we can now measure how many people can travel to a park in a given time by traveling along the road network. This level of sophistication makes it much easier to say specific things about what combinations of people, housing types, and other features that paint a more detailed picture of true need.
The second force is greater desire to understand park accessibility as urban living surges. Urban parks are a critical part of the urbanism equation: they provide the open space, greenery, and social space necessary for making denser, yard-less housing types livable. If we want to see more people living in denser, more walkable cities, access to parks is a critical ingredient for making those urban neighborhoods work, and it’s more important than ever to uncover true needs and prioritize smartly.
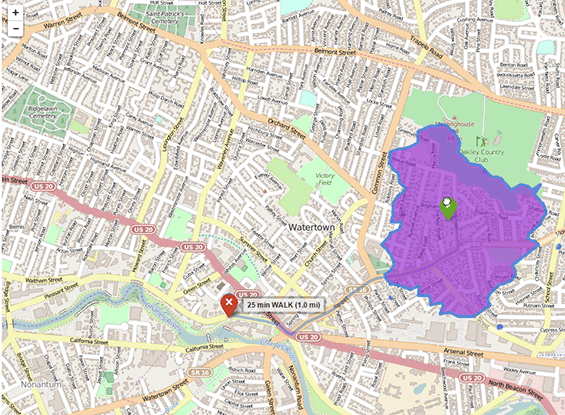
Tools like OpenTripPlanner go beyond traditional walkshed circles, showing how walkability is related to street design
Data on housing types—attached townhomes, apartments, or single-family houses—paired with demographics can be used alongside accessibility measures to test the “fit” of a community to the locations and types of parks available. Parks surrounded by a 10 minute walkshed that contains lots of children in more compact housing unit types can be prioritized for extra playground equipment and green space to absorb the additional demand. Similarly, neighborhoods surrounded with large yards might benefit from other park amenities that complement, rather than compete with, individual yards.
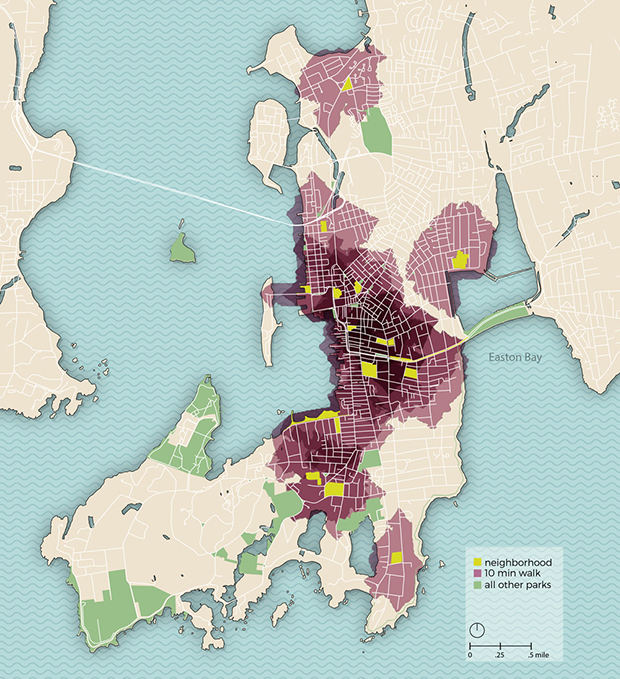
Accessibility analysis was used to identify resident access to local parks within a 10 minute walk for Newport, RI. Darker areas are have access to more parks within 10 minutes.
By Ken Goulding. Ken is a principal at Sasaki and director of Sasaki Strategies. Ken brings a designer’s eye to data visualization and strives to enhance comprehension of data, elevate communication of complex information, and enhance decision making.
Once we’ve figured out where our parks can have the most impact and reach the most people, we are left with the question of how much we need to invest to bring these parks up to an acceptable condition to be enjoyed. We need to figure out both how much we need to spend upfront on capital improvements and how much we would have to spend on an ongoing basis for operations and maintenance costs.
One way to approach this is to set a target for what we would consider a baseline acceptable condition that would not detract from the enjoyment of the park, and then consider how much we would have to spend in order to bring all facilities and amenities up to that level. This gives us a baseline metric that can give a sense of minimum overall capital required and also helps prioritize capital expenditures so that they can have the greatest impact.
This approach is borrowed from the campus planning world, where capital improvements are made to building and grounds facilities to bring them up to a defined target condition level. Based on the condition of the existing components within a building combined with what it would cost to replace or restore them, we can come up with a number that represents the maintenance “liability” for that building–or how much we need to spend in order to bring it up to par.
Borrowing from this approach to look at Boston-area parks in preparation for the NRPA Innovation Lab held here next week, we were able to use basic metrics from the Allston/Brighton parks data set to come up with some rough metrics for how much would need to be spent on each park to meet condition goals. The result is some rough, but useful metrics that can help paint a picture of where existing deficits are on the map and can be considered alongside metrics like access and level of service in the decision making process.
Example of a high-level analysis of “maintenance liability” for Allston/Brighton Parks
Amenities in this dataset are rated as Unusable, Poor, Fair, Good or Excellent. Our target condition goal in this example is Good and we use the assumption that to get from Fair to Good will require us to spend 25% of replacement value, from Poor to Good requires 50% and from Unusable to Good requires 75%. We calculate the full replacement value using some rough metrics based off type of amenity as well as its size and material properties. For this exercise we used some fairly broad heuristics, but a more sophisticated analysis would require a deeper dive and custom collaboration based on regional construction costs and past expenditures.
The results of this analysis will be shared at the NRPA Innovation Lab, “Data Driven Government and Parks and Recreation”, coming to Boston on May 12 – May 13.
By Siqi Zhu. Siqi is an urban designer at Sasaki. His expertise spans downtown and district planning, public realm, data visualization, and information design.
Parks are inarguably important urban amenities, and parks investment represents a critical lever for shaping urban change and encouraging growth. At a time of constrained resources and competing demands for city building, the question of how to anticipate, amplify, and ultimately capture the value of economic development must become a central question in thinking about strategies for parks investments.
It has become evident that parks have great power to spur economic development in unexpected places, turning unused or grossly underused parcels into high value–and value-generating–destinations within a city. Successful examples abound in recent years: the High Line in New York played a central, catalytic role in transforming a formerly industrial Lower Manhattan neighborhood into a hub of commerce and culture; closer to home, Sasaki’s Lawn on D activated and gave identity to the tabula rasa development around Boston’s Convention Center, contributing to the burgeoning growth of that district.
Still, there exists a great opportunity for decision makers to draw a more explicit link between parks investments and the economic development potential that these investments can leverage. In the same way that investment decisions are evaluated against the underlying demographics, they could also factor in development trends and potential, using the development and permitting database that agencies like the Boston Redevelopment Authority (BRA) already maintains to understand the relationship between development value and proximity to quality park spaces within the city. Where are developments happening? What new demographics do these developments introduce? What underlying economic momentum does this reveal? And how can catalytic parks investment contribute to this momentum? Questions like these are inherently forward-looking, and that’s where it gets exciting: while census data provide a snapshot of the past, this kind of projection instead starts to illuminate who the parks might serve in the future.
Sasaki is an award-winning interdisciplinary practice based in Watertown, Massachusetts that is composed of architecture, interior design, planning, urban design, landscape architecture, graphic design, and civil engineering disciplines. The Sasaki Strategies team acts as a problem-solving unit to support these disciplines by creating custom software tools, data visualizations, and workflow efficiencies that empower better design.