What-If Modeling
You can’t have it all. Decisions have to be made about priorities and trade-offs. But how do you engage in a meaningful dialogue? We draw on our knowledge and experience to build models on our custom platform so our clients and design teams can rapidly test ideas and get everyone on the same page.
Decisions often need to be made in complex contexts. Modeling that complexity is difficult — but thankfully seldom necessary. Simple, visual models can be very effective in helping understand relationships of cause and effect.
We draw on the experience of our clients and Sasaki teams to piece together representations of reality that can let us test what-if scenarios in real-time interfaces. While never a perfect representation of the real world, these models provide a path forward and can help clients make informed, timely decisions and build consensus.
Drawing on in-house expertise, we designed and developed a dashboard that allows campus planners to quickly test different mixes of housing typologies. Scenarios and assumptions can be changed instantly — either globally or for any number of unit types. To account for seasonal flux, we provide the option to set different income assumptions on a monthly basis. The responsiveness of the models provides an intuitive connection between changing choices or assumptions and seeing the impact of those decisions.
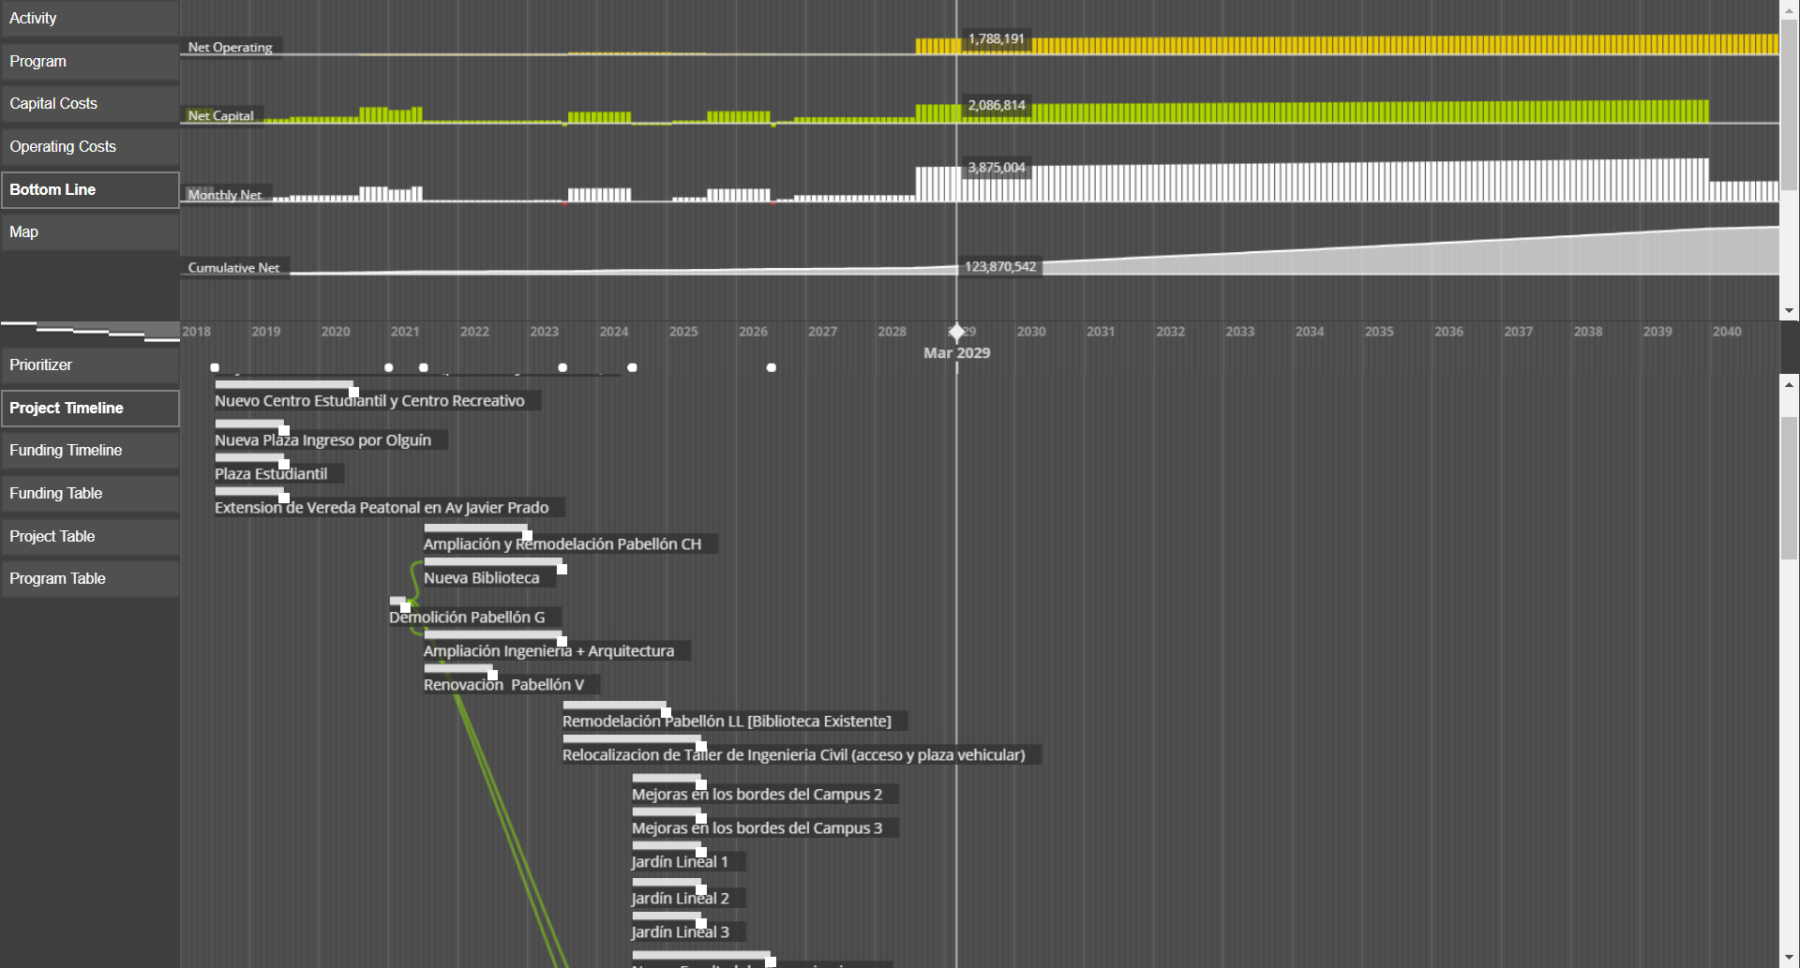
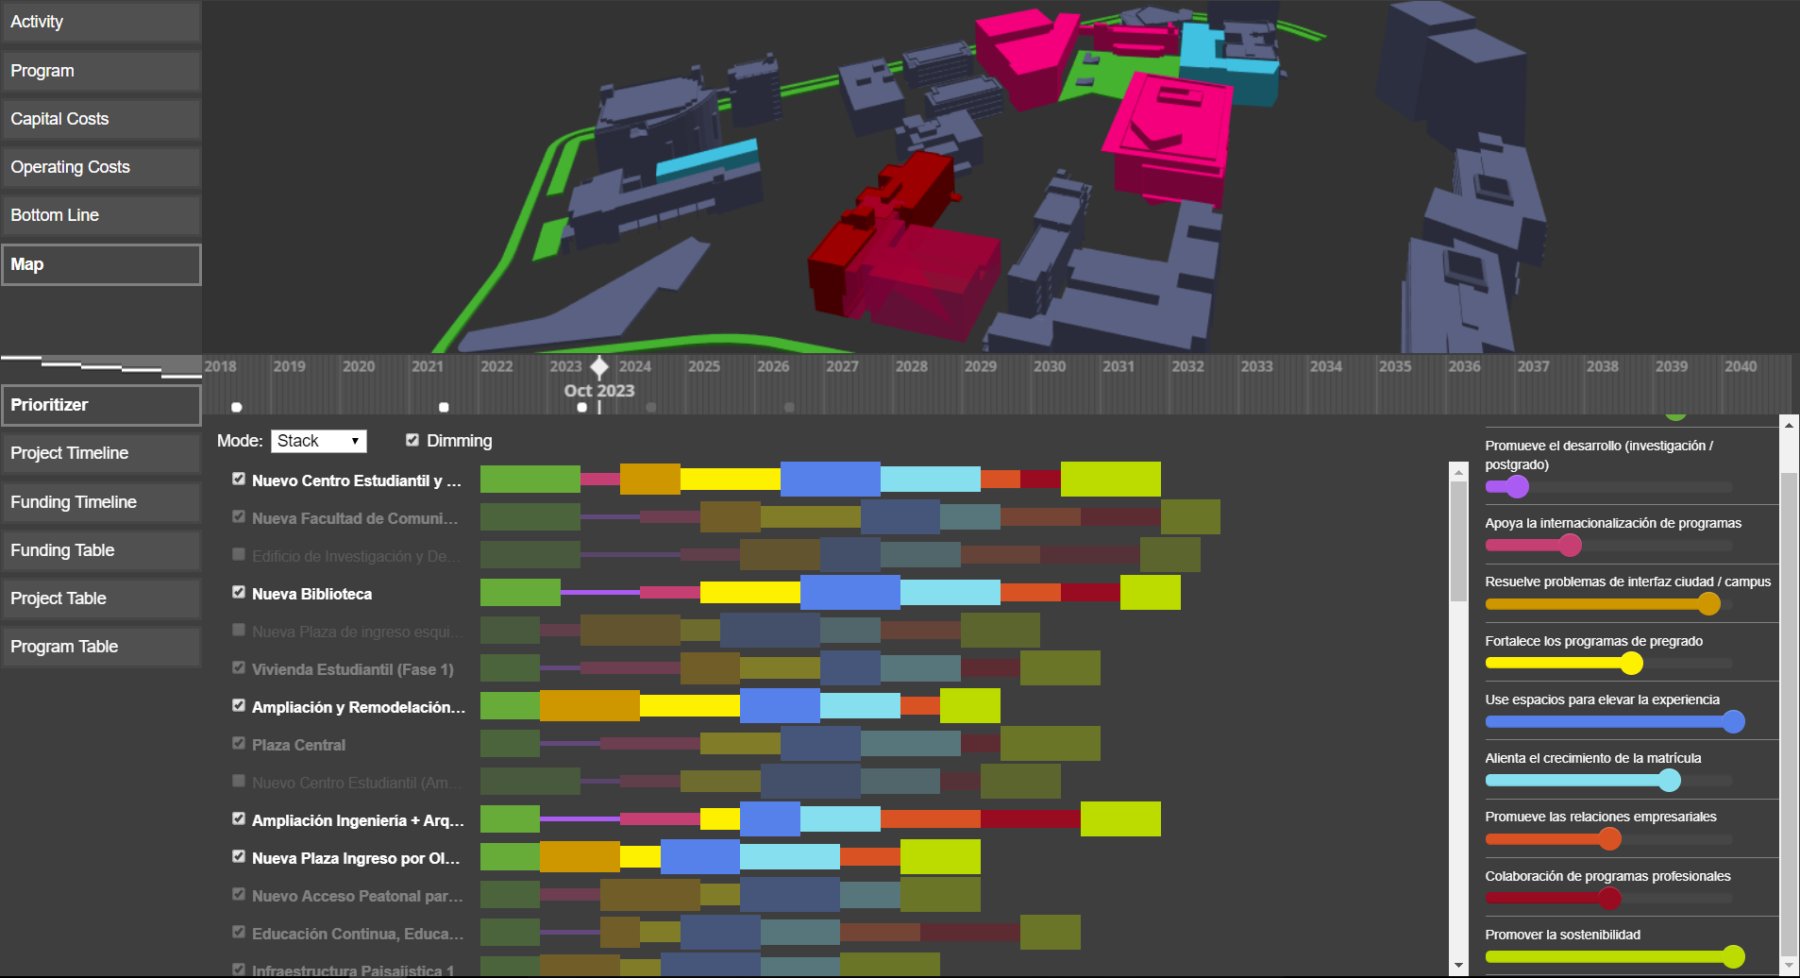
Our capital prioritization tool allows clients and teams to comprehensively work through prioritization and sequencing of projects. Our integrated Prioritizer tool provides a framework for scoring and ranking projects according to high-level goals. The ranked list can then be used to inform decisions about sequencing on a timeline, while also taking into account project dependencies, available funds, and other constraints.
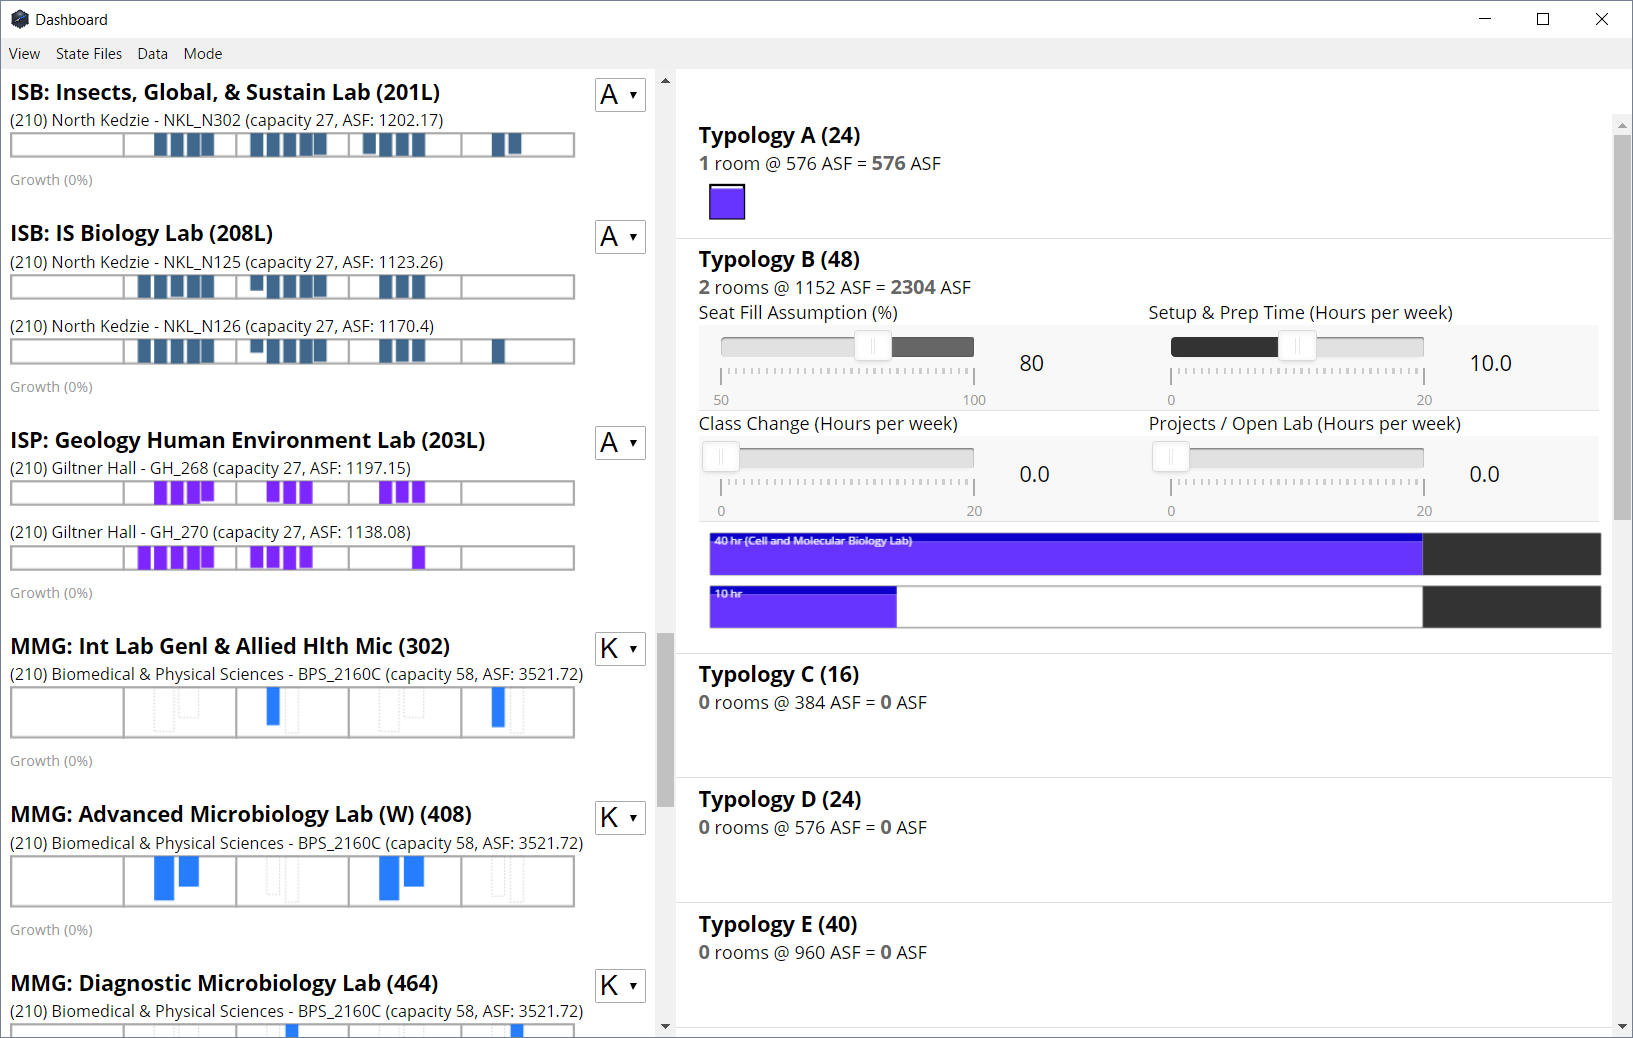
To help transition to a new set of lab typologies, we created this model to understand and anticipate lab needs and departmental growth. The system shows existing space-use schedules on the left, but shifts to a more abstract representation of future needs and assumptions on the right. This approach to structuring information helps ease the jump from concrete and specific data to abstract and flexible metrics while keeping a common language.
There is often a tension between the available budget for a new building and the list of program elements that stakeholders desire. This dashboard provides a way to hone in on feasible mixes of program elements by keeping an eye on square footage and construction costs while testing the size and number of various program elements, such as offices or conference rooms.
More Data & Design Tools