Visualizer
 Sasaki
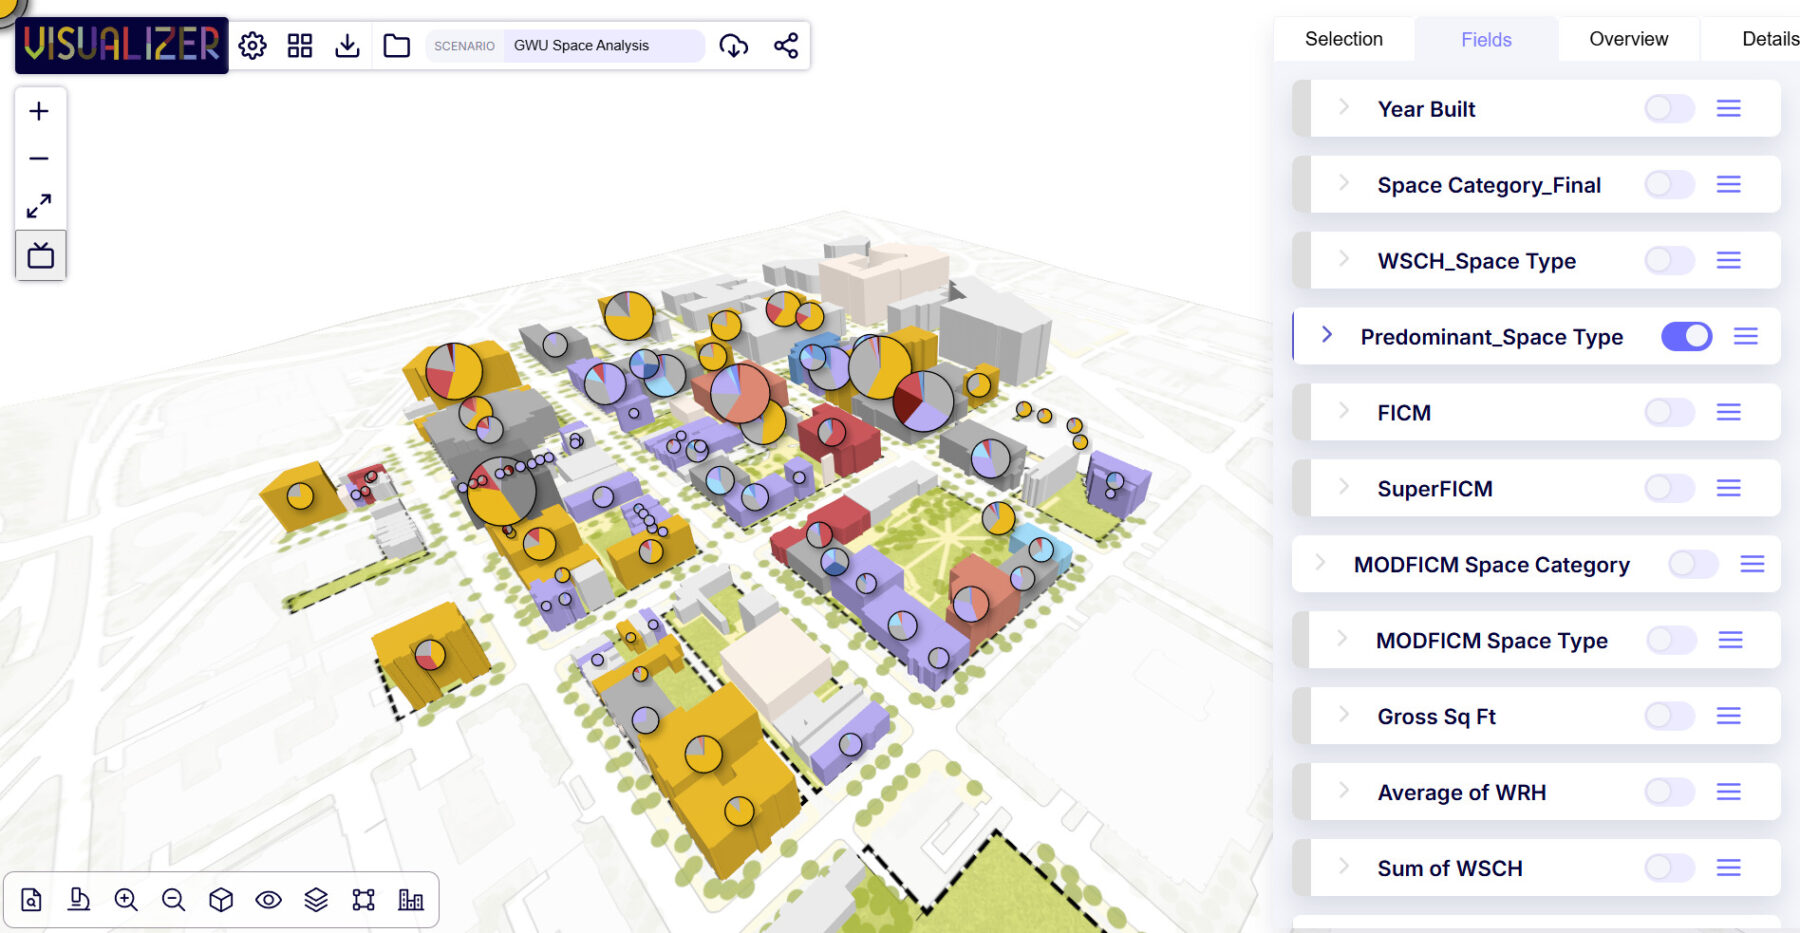
Visualizer helps teams analyze, collect, and export insights about a project’s inventory and usage while producing beautiful, presentation-ready data visualizations.
Across all projects, design teams are working with large amounts of data– such as parcel data, building conditions and utilization– that needs to be thoughtfully and visually organized. Often, this requires making various analysis diagrams and maps, which is a slow and laborious process. Visualizer dramatically simplifies the process of creating data-driven analysis visualizations, accelerating insight-generation and decision-making. In short, Visualizer helps teams visualize and make sense of data simply and beautifully.
The application is programmed to streamline the creation of various diagram types, accelerating the processing of data-based information into visualizations. It effectively enables teams to efficiently create beautiful, presentation-ready slides of content with graphic consistency in a short period of time. By combining inventory and utilization data to generate insights about potential needs, Visualizer provides a central data hub for project teams, enabling quick fact-checking during the decision-making process. With live data editing features, Visualizer provides a quick view of alternative phasing scenarios.
Learn more about our Data & Design Tools from the Sasaki Strategies team.