Design Thinking Tools
Design is not Math. There is no singular ‘right’ answer for a design solution. But design can be measured across a broad spectrum of factors. The earlier we can start measuring our designs and understanding and discussing their impact, the more confident we can be that the design will succeed on multiple fronts.
As tools continue to advance and computation can offer deeper analysis across a broad variety of factors, we run the risk of letting design become too focused on optimization. We are mindful that there is seldom a perfect alignment between what we are able to measure easily and what matters.
Our solution: use technology to make us better designers. Our analysis tools, models and visualizations help us achieve a better understanding of design impacts and constraints. To achieve designs that are both functional and beautiful, our designers internalize the workings of the design problem so that analytical rigor can be seamlessly woven into the design thinking process.
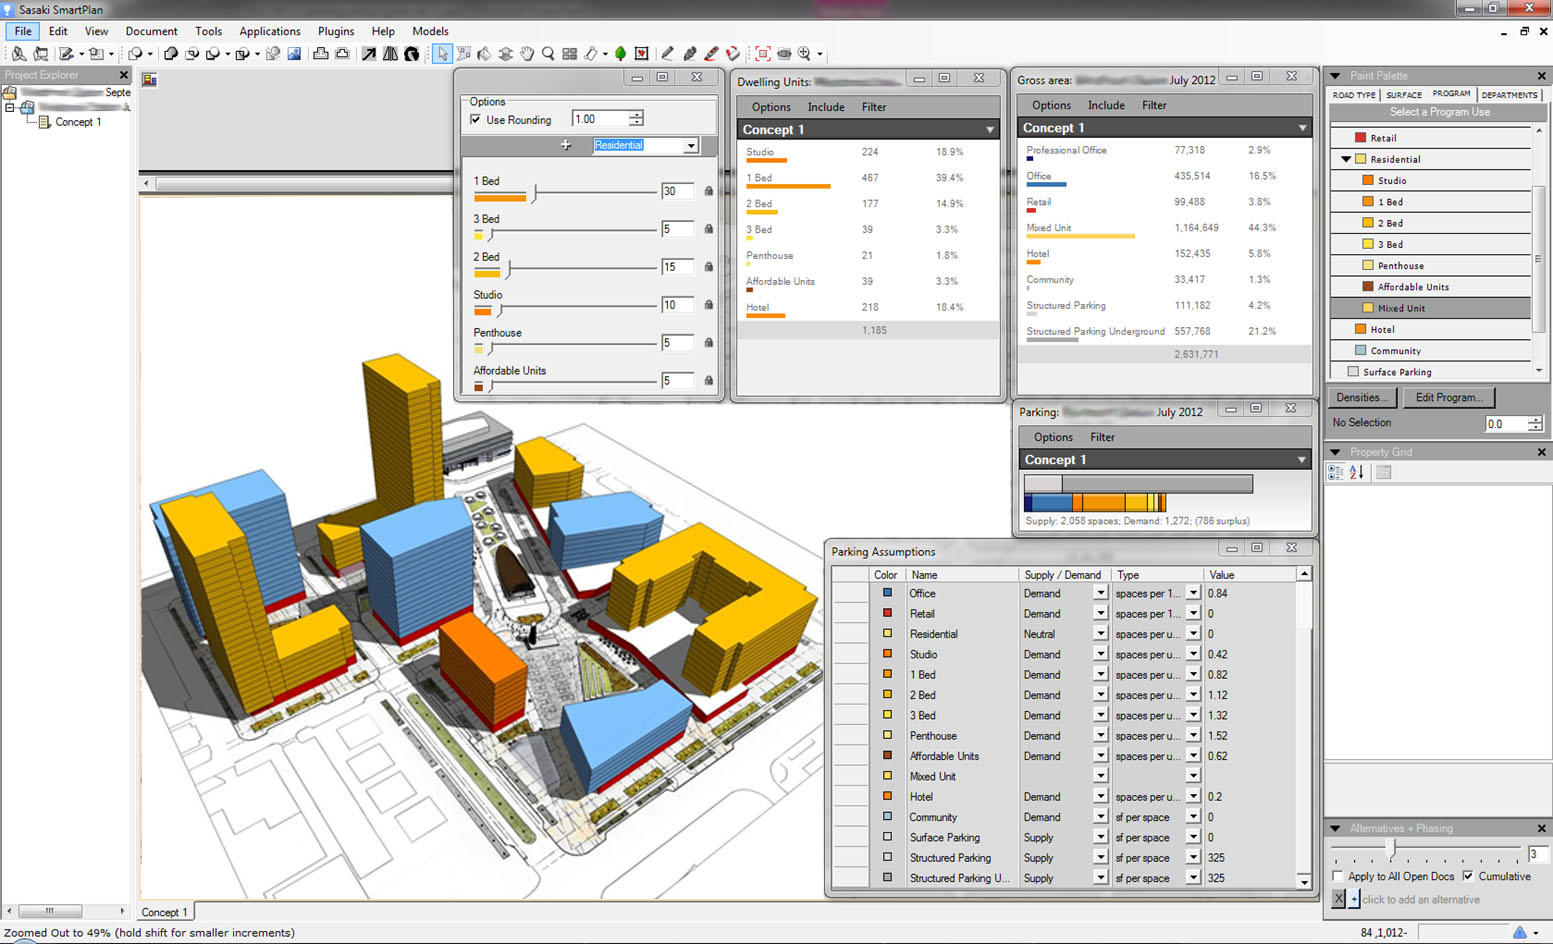
We believe it’s never too early to start evaluating designs. Our tools let us integrate closely into our design workflow so the answers to our clients’ questions are readily at hand throughout the design process. The sooner we have those answers, the more informed our designers can be about what matters to clients and their stakeholders and the more we can align our design efforts with creating value.
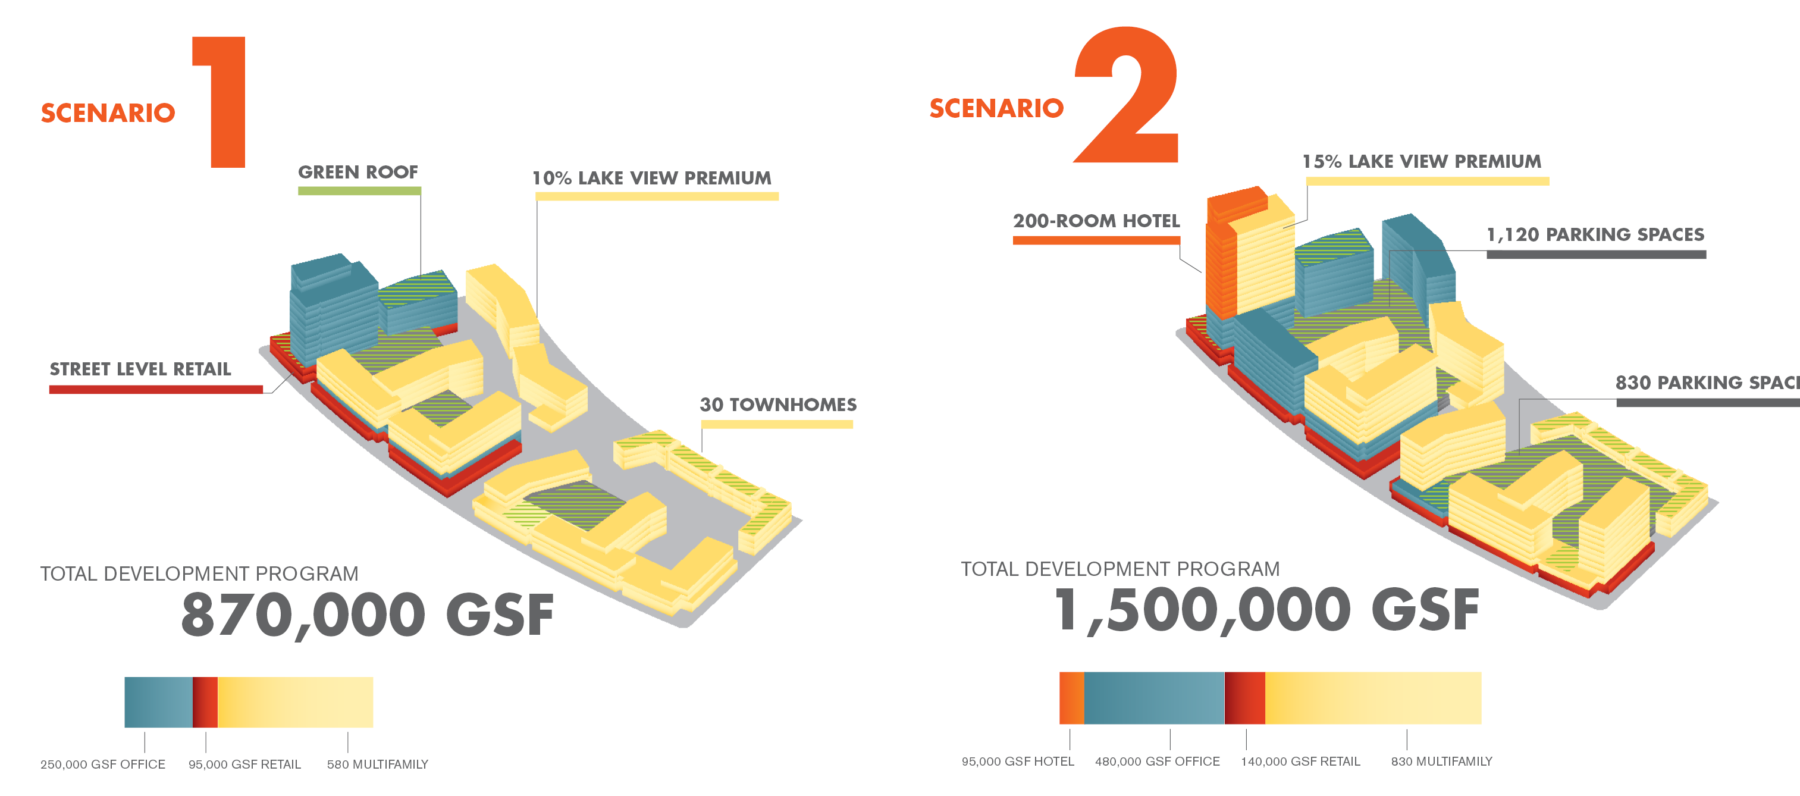
Many design impacts can readily be evaluated using a set of existing models, while custom models may be created once we understand a client’s particular constraints and needs.
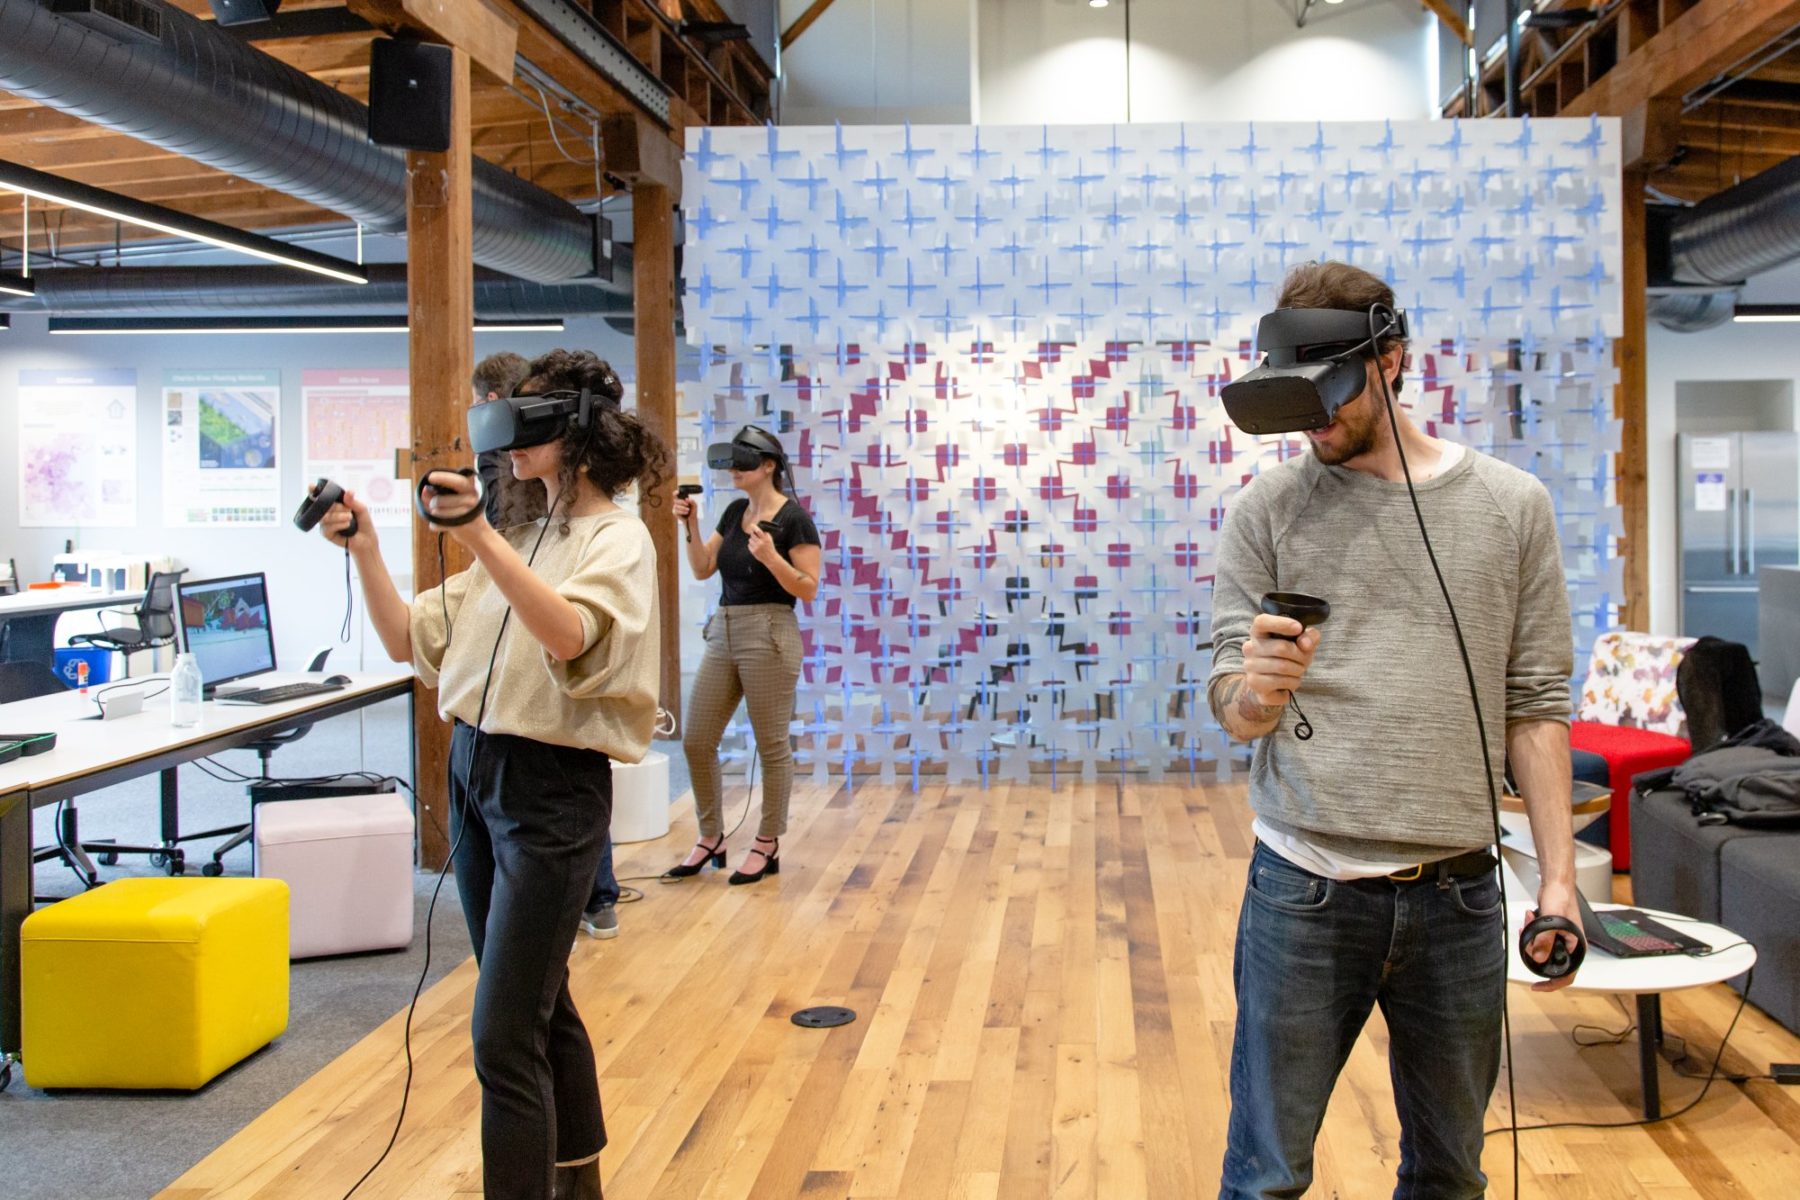
In addition to hard metrics, technology gives us additional lenses to evaluate design. Virtual reality design tools let us design from a first person perspective so we can think differently about spatial relationships and a person’s experience. When we put someone directly into our design we can get their feedback faster and iterate towards successful outcomes together.
How can we provide the best views within the buildings we design while keeping from blocking the views of others? Our view analysis tools let us quickly analyze thousands of first-person perspectives. While many view analysis tools allow users to look at all views from a single point in space or views of a single object, our tool goes a step further, letting us look at the entire viewing sphere from any number of points. This means we can look comprehensively at view performance across different design options. We take advantage of powerful real-time rendering techniques to boost the speed of our analysis so we can get answers faster.
Shadow studies are interesting — and are often required for permitting. However, it’s difficult to know exactly what the goals are when looking at shadows. During which months of the year and at which times of day should our designs provide shade or to allow sun? Climate Comfort Hours provides a single indicator (KPI) for sun and shade. With this metric we can measure performance across a site and easily compare alternatives. We can also see exactly how our design contributes to those numbers and modify the design accordingly.
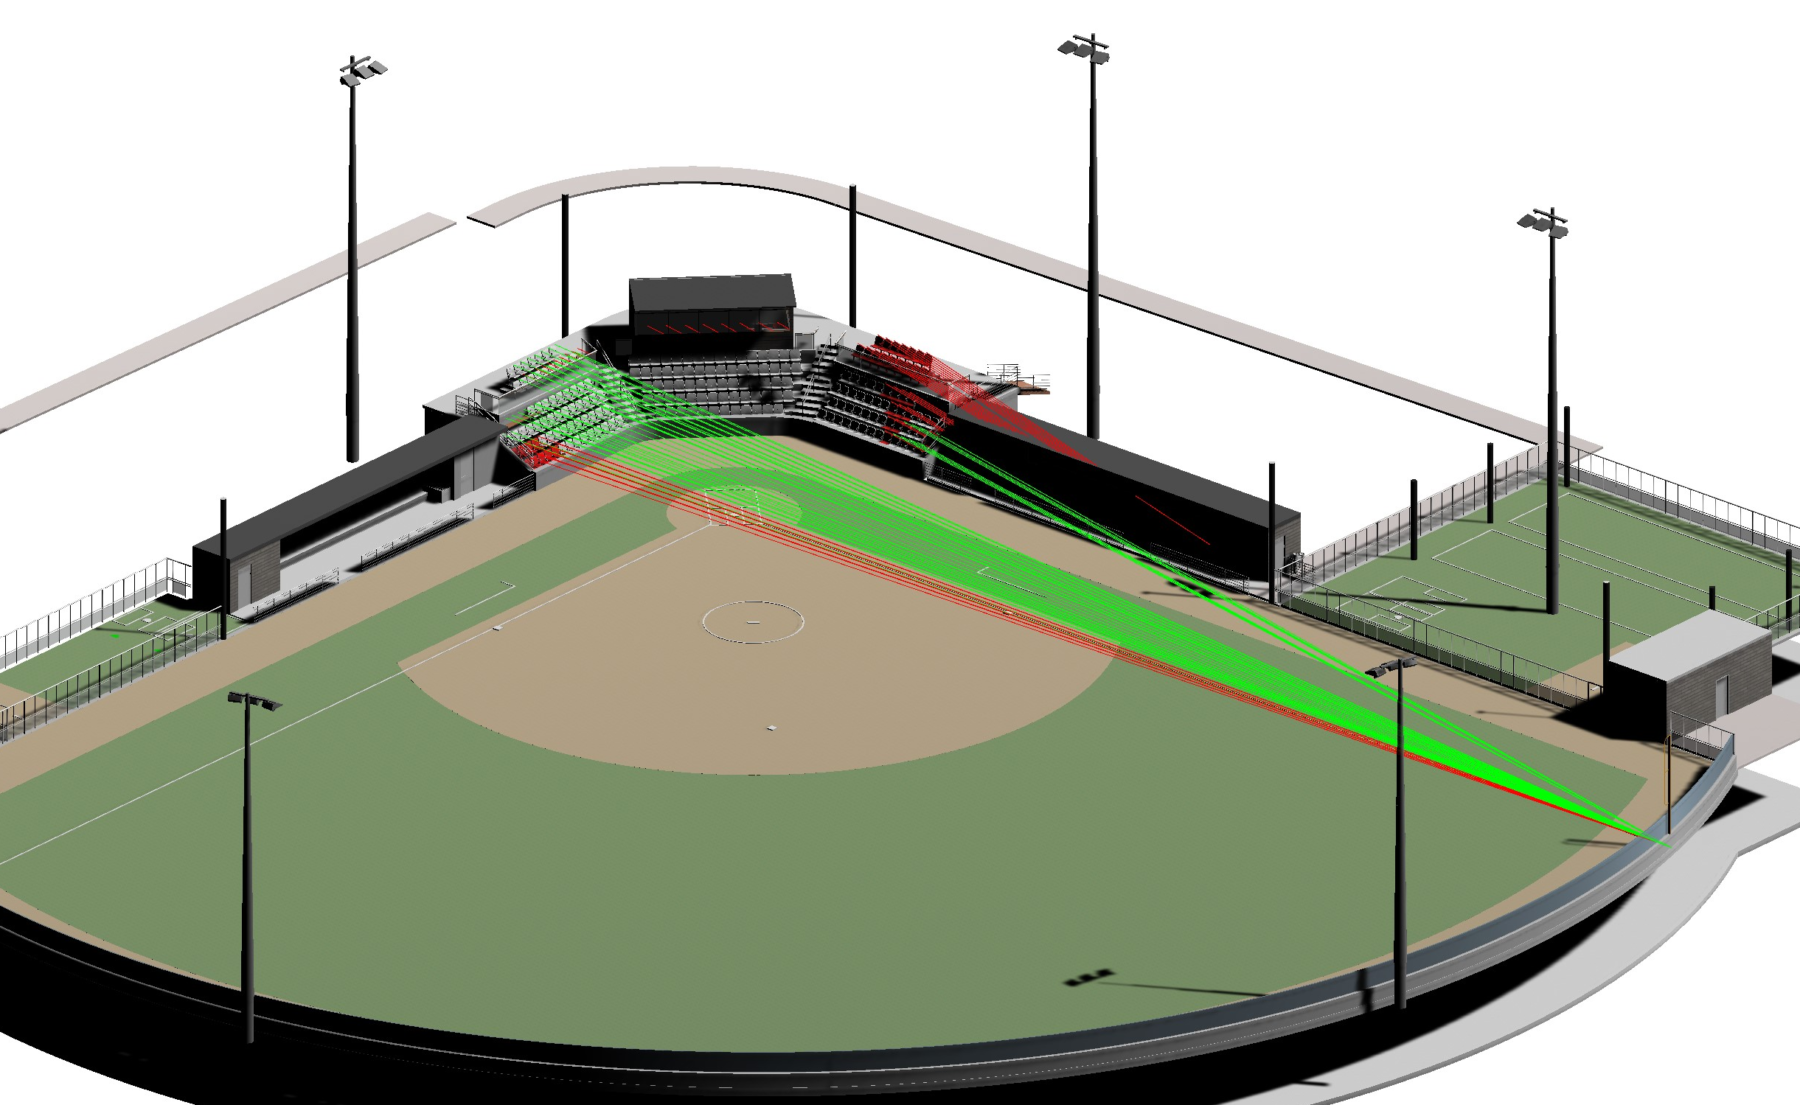
Sightly is a Virtual Reality (VR) integration with AutoDesk Revit that lets us test sightlines from a viewer’s perspective to key elements in the design. In this example of a ballpark, the red lines indicate that a dug-out is obscuring the foul pole. The tool highlights those seats with obstructed views and lets us put ourselves into those seats, virtually, so we can consider how best to improve the design. By integrating directly with Revit, our design teams can make instant modifications to the design, allowing for quick assessment and testing through rapid iterations.
More Data & Design Tools