Data Analytics
What are the patterns and stories hiding in the data? Sasaki’s analysts and technologists are experts at piecing together data from a variety of sources and teasing out answers. We work closely with our clients and designers to understand your questions.
Our expertise spans spatial tools, data science, web-based maps and visualization. When the right tools don’t exist we build them.
See a selection of our tools, below, and read on for some recent case studies.
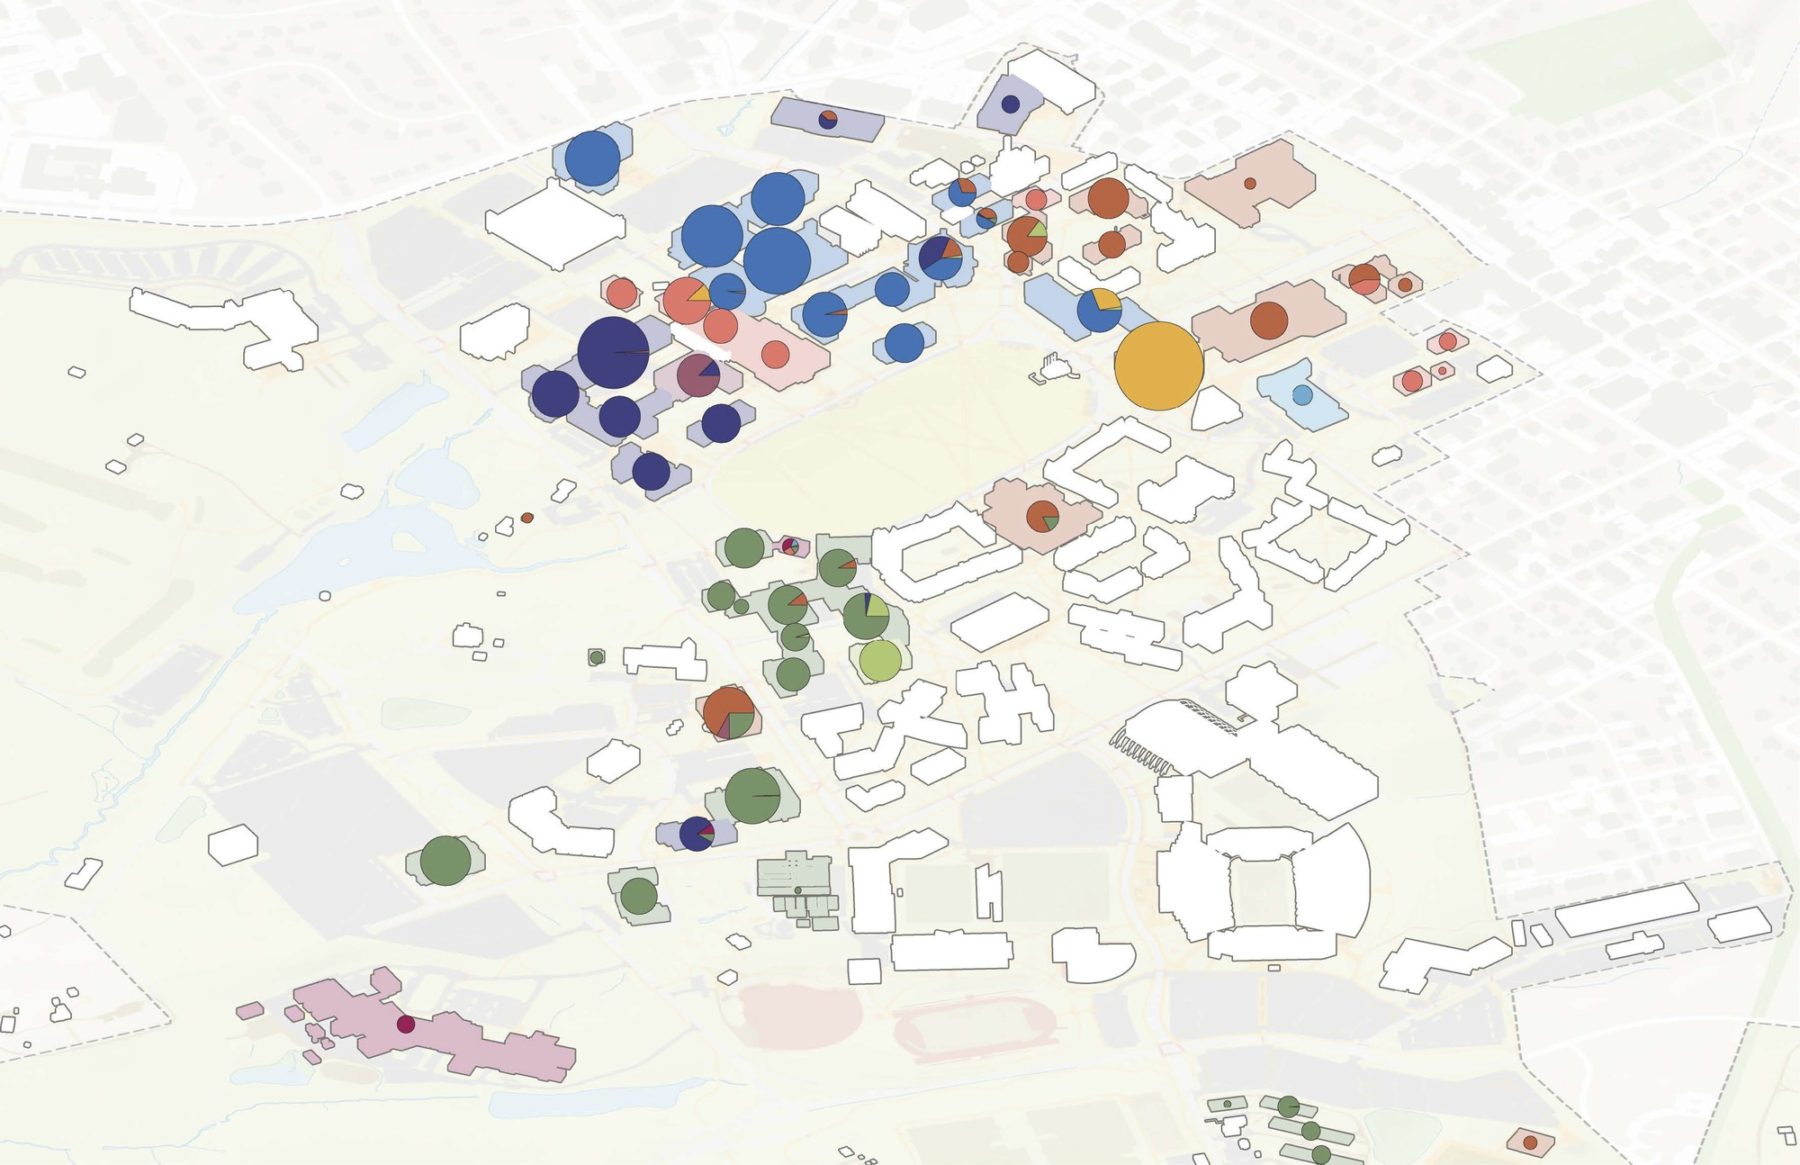
Colorizer: Dynamically color SketchUp objects and export images based on Excel data. This makes it easy to map data onto any drawing.
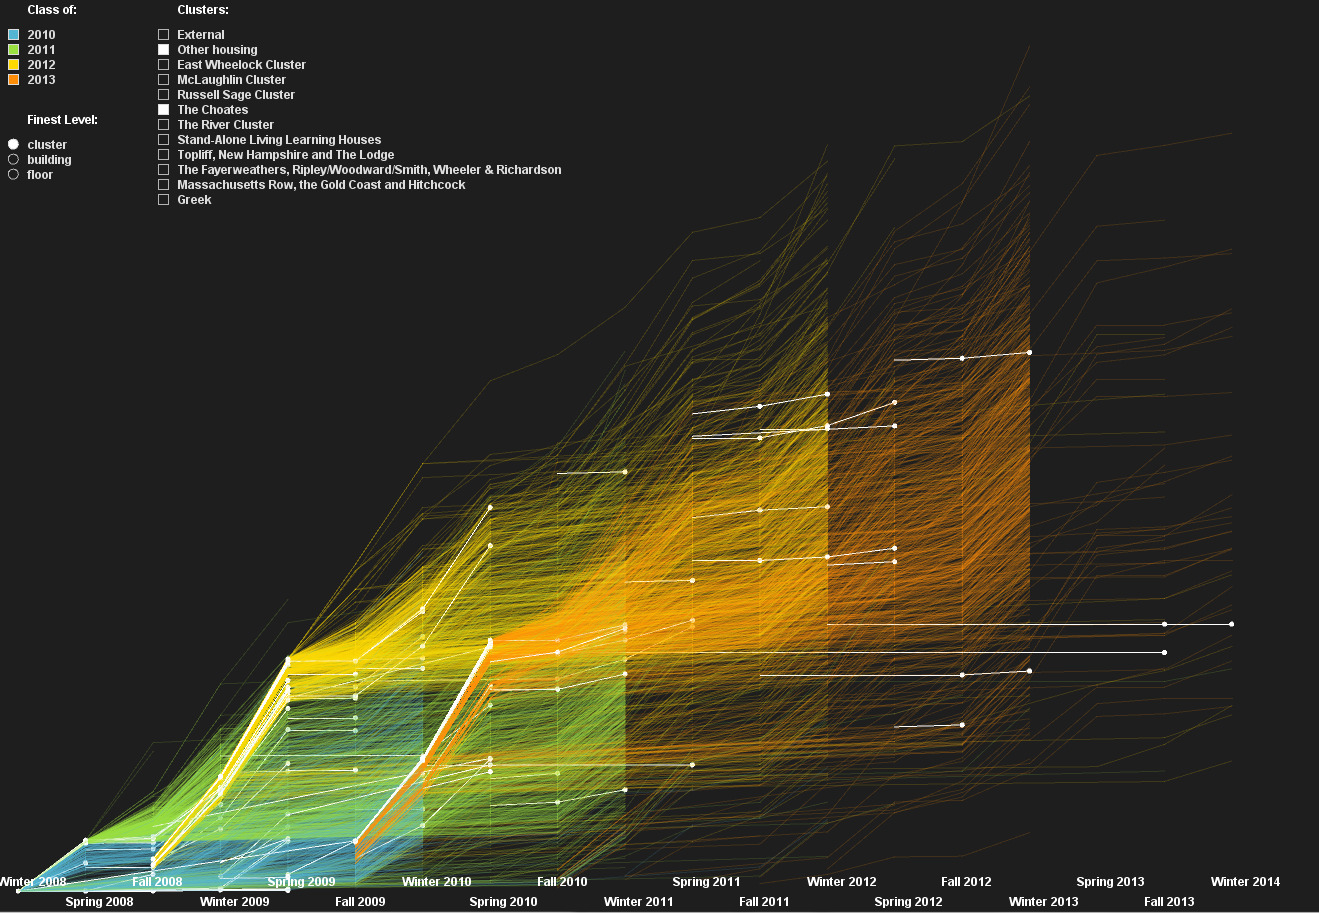
Continuity / Tree Maps: Starting with the idea of a datapoint as a single dot, users can transform the same dataset into maps, charts, and explore time through animation. This fluid approach to visualization makes it possible to quickly explore a dataset to find insights, and then construct a set of visuals that tell a story.