HUD does a great service by collecting and sharing a considerable amount of data and information. Still, we need to build on this to paint a more complete picture of homelessness. By enhancing the level of detail collected, integrating data consistently and comprehensively, and thinking creatively about data collection methods, data could be shared and compared more easily and work toward alleviating homelessness could be better coordinated. Here are a number of dimensions to consider in building on HUD’s already robust data collection infrastructure:
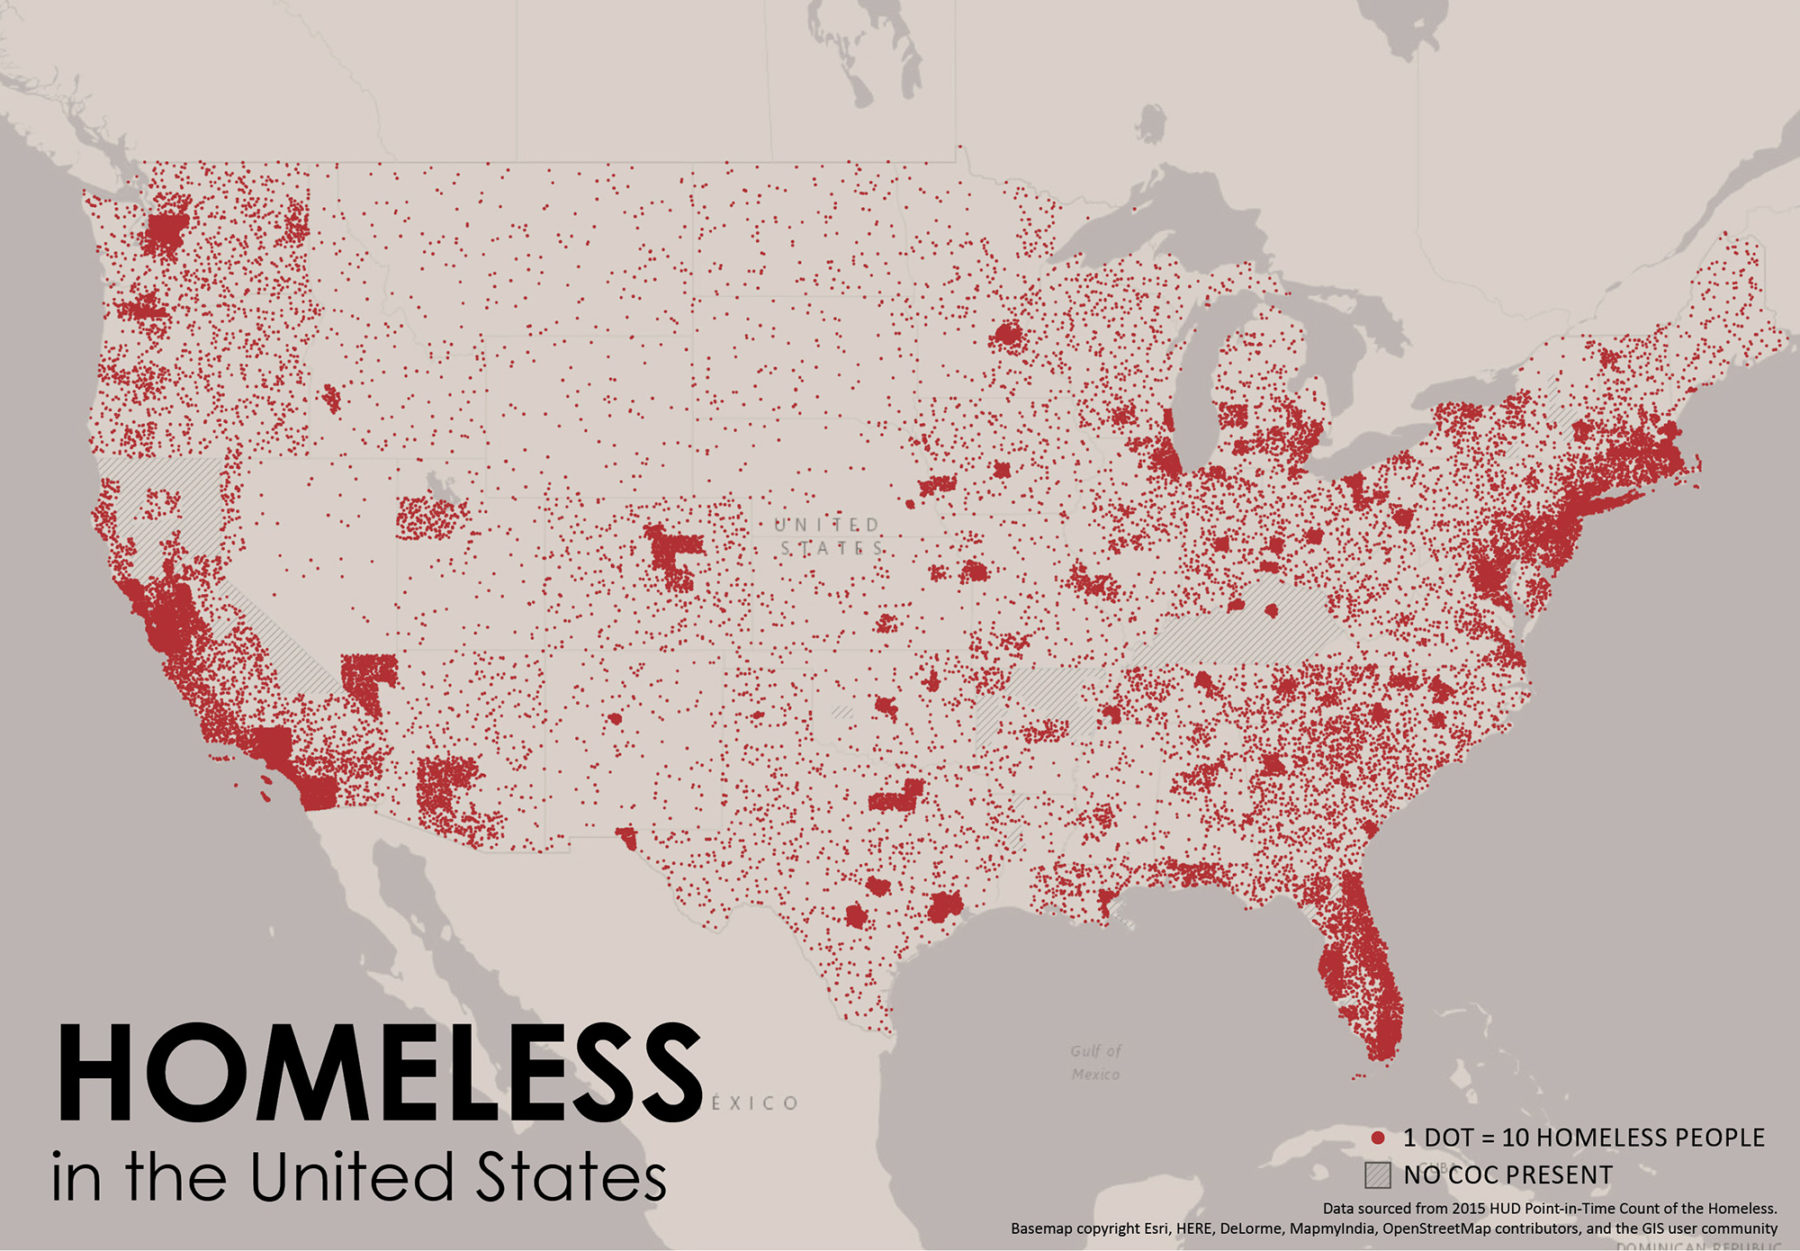
Location specificity. Where current systems aggregate the count of homeless populations in varying scales (from a portion of a metro area to an entire state in some cases), more specifically geolocated data — using a tool like Fulcrum or What3Words, for example — would better provide a more nuanced and useful understanding of homeless population distribution and relationships to other urban factors.
Integration. Where current information systems are maintained by distinct CoC districts, a single nationwide system could enable services to be better coordinated and would allow for easier comparative benchmarks across geographic boundaries.
Accessibility and transparency. Where current methods include the capture of many different demographic data points and metrics that can quickly become complex to interpret, a streamlined and interactive interface could allow broader access to and easier exploration of the data.
Scope. Where current data collection is largely driven by volunteers conducting headcounts (with inevitable potential for error), strongly incentivizing self-reporting as a collection method may help to capture more complete information and sub-populations not included currently.
A powerful tool for strategic planning and resource allocation can be created through the improvement of data collection methods for homeless populations, the ability to better visualize and interpret the information, and the integration of disparate information systems into a unified whole. Most importantly, there are a number of ways these improved datasets can help park and recreation departments — in close collaboration with other departments and agencies — better address issues of homelessness and the associated conflicts and negative perceptions.
Tailored service provision. Imagine if a community could better understand the needs and challenges of a localized homeless population. Knowing, for instance, that the majority of the homeless population within a 10-block radius was comprised of single mothers, parks and recreation staff could focus on providing specialized child care or customized job-training.
Symbiotic relationships. Imagine if a community could better understand the condition, skills and backgrounds of its homeless population. Like the city of Albuquerque, that hires its homeless as city workers, park and recreation departments could create programs to seasonally or permanently employ readily available homeless workers.
Homeless addresses. Imagine if homeless individuals — traditionally migratory and hard to locate — had a geolocated “address” (for instance, by using a technology like What3Words which creates a named location for every 3 square meters on the planet). Communication and community-building could be much improved, allowing for greater collaboration.
Public engagement. Imagine if a community could better access the stories and profiles associated with existing homeless individuals or families. Care for the city’s homeless could be shared more communally if local residents were engaged, inspired and able to help in direct and tangible ways.
In addition to the myriad innovative approaches being tested across the nation, the strategies outlined here are the beginning of a data-driven approach to thinking differently about the challenges of homelessness.
Keillor’s research on homelessness will be published online on October 1. Her research will also be presented at the upcoming 2016 NRPA Annual Conference, October 5-8 in St. Louis, Missouri, as part of a presentation and panel discussion titled, ‘Stories vs. Statistics: Understanding Homelessness in Our Parks and Cities.’ Click here for time, date and location information.
References:
Danielle Taylor, “Taboo Topic: Homeless in the Park,” NRPA Open Space Blog, January 22, 2014
James Manyika, Michael Chui, Brad Brown, Jacques Bughin, Richard Dobbs, Charles Roxburgh, Angela Hung Byers, Big Data: The Next Frontier for Innovation, Competition, and Productivity, McKinsey Global Institute Report, May 2011
Public Streams website
Array of Things website
Brad Barnett, “Making Sense of Accessibility Metrics,” Sasaki Associates, Inc. Blog, 2016
Using Data at Park and Recreation Agencies, National Recreation and Park Association, 2016
HUD Exchange, Continuum of Care webpage
HUD Exchange, 2015 AHAR: Part 1 – PIT Estimates of Homelessness in the U.S. webpage
The 2015 Annual Homeless Assessment Report (AHAR) to Congress, The U.S. Department of Housing and Urban Development, Office of Community Planning and Development, November 2015